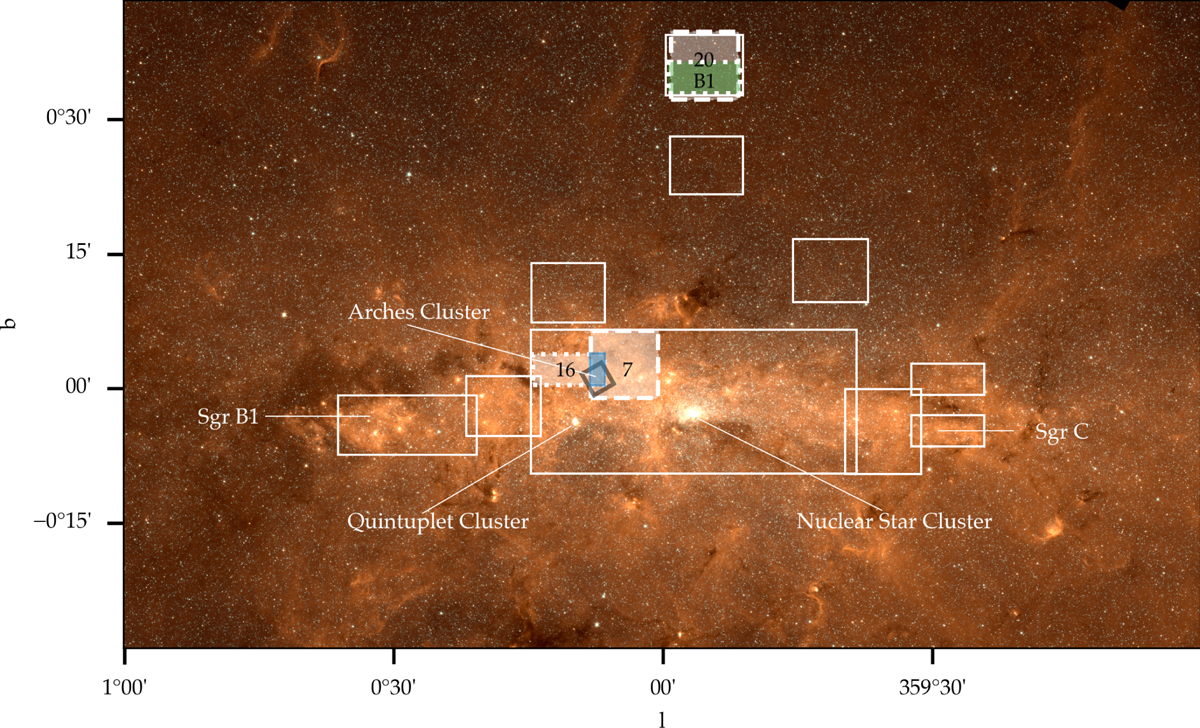
Fig. 1
Download original image
GNS survey fields overlaid on a Spitzer/IRAC color mosaic (3.6,4.5, and 8 μm; Stolovy et al. 2006). Solid white lines indicate the full extent of the GNS. White shaded regions mark the fields analyzed in this work, while dotted and dashed outlines denote the fields of view of the GNS I and GNS II pointings, respectively. The black numbers label the individual fields (see Table 1). Green and blue areas indicate the regions where we computed PMs. The green area corresponds to a field on the Galactic bar, and the solid blue box corresponds to the GNS fields that overlap with the Arches cluster. The black box shows the coverage of the catalog from Hosek et al. (2022).
Current usage metrics show cumulative count of Article Views (full-text article views including HTML views, PDF and ePub downloads, according to the available data) and Abstracts Views on Vision4Press platform.
Data correspond to usage on the plateform after 2015. The current usage metrics is available 48-96 hours after online publication and is updated daily on week days.
Initial download of the metrics may take a while.