Fig. 14
Download original image
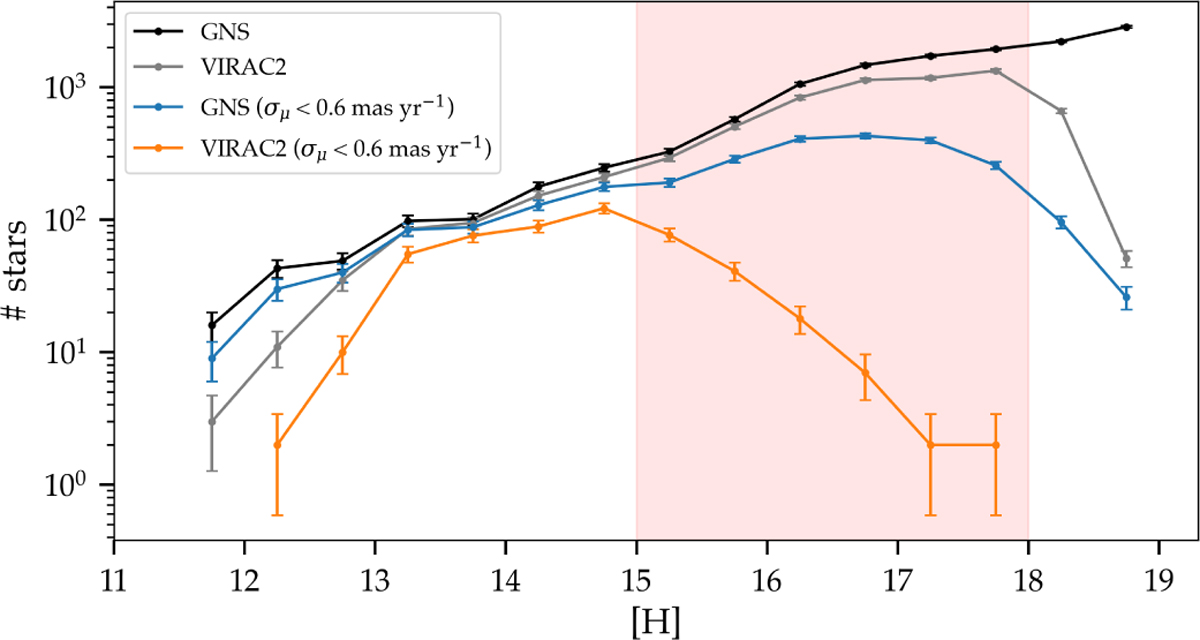
GNS and VIRAC2 H-band luminosity functions for the NSD field (blue box in Fig. 1). The black and gray histograms show the luminosity functions from GNS and VIRAC2, respectively, for all stars with measured PMs. The blue and orange histograms show the luminosity functions after applying a PM uncertainty cut, excluding stars with errors larger than 0.6 mas yr−1. The red shaded region marks the approximate location of the red clump stars.
Current usage metrics show cumulative count of Article Views (full-text article views including HTML views, PDF and ePub downloads, according to the available data) and Abstracts Views on Vision4Press platform.
Data correspond to usage on the plateform after 2015. The current usage metrics is available 48-96 hours after online publication and is updated daily on week days.
Initial download of the metrics may take a while.