Fig. 15
Download original image
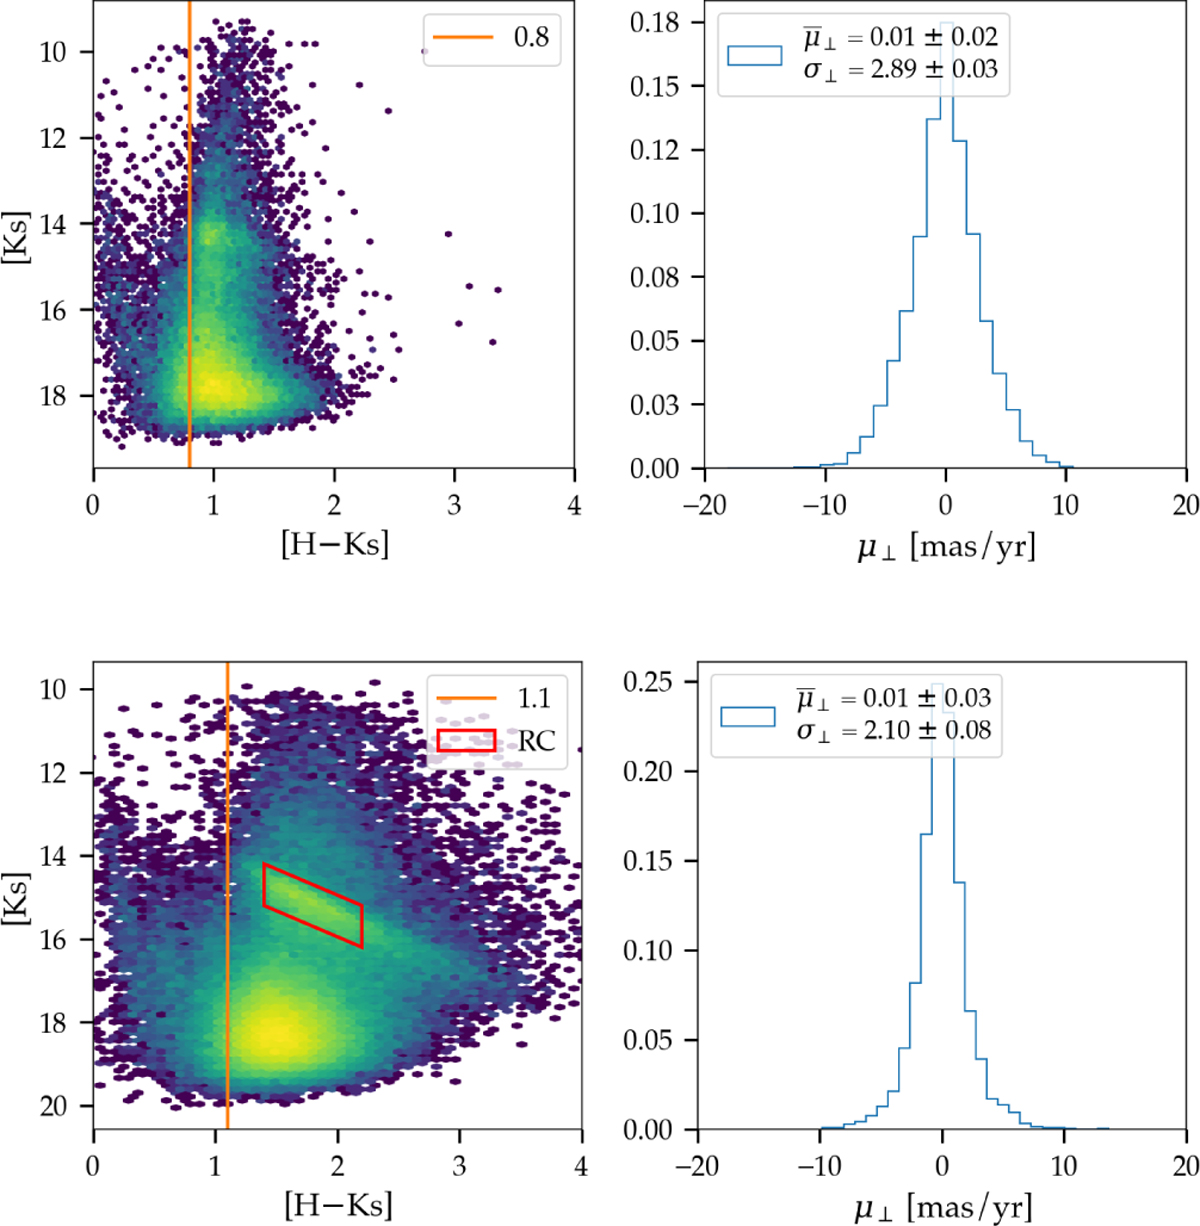
CMD and distributions of the vertical component for relative PMs for the bulge (top) and NSD (bottom) fields corresponding to the green and blue boxes in Fig. 1. The vertical orange line in the CMD indicates the color cut applied to remove the foreground. The red box in the CMD in the bottom panel marks the approximate position of the red clump stars.
Current usage metrics show cumulative count of Article Views (full-text article views including HTML views, PDF and ePub downloads, according to the available data) and Abstracts Views on Vision4Press platform.
Data correspond to usage on the plateform after 2015. The current usage metrics is available 48-96 hours after online publication and is updated daily on week days.
Initial download of the metrics may take a while.