Open Access
Fig. 6
Download original image
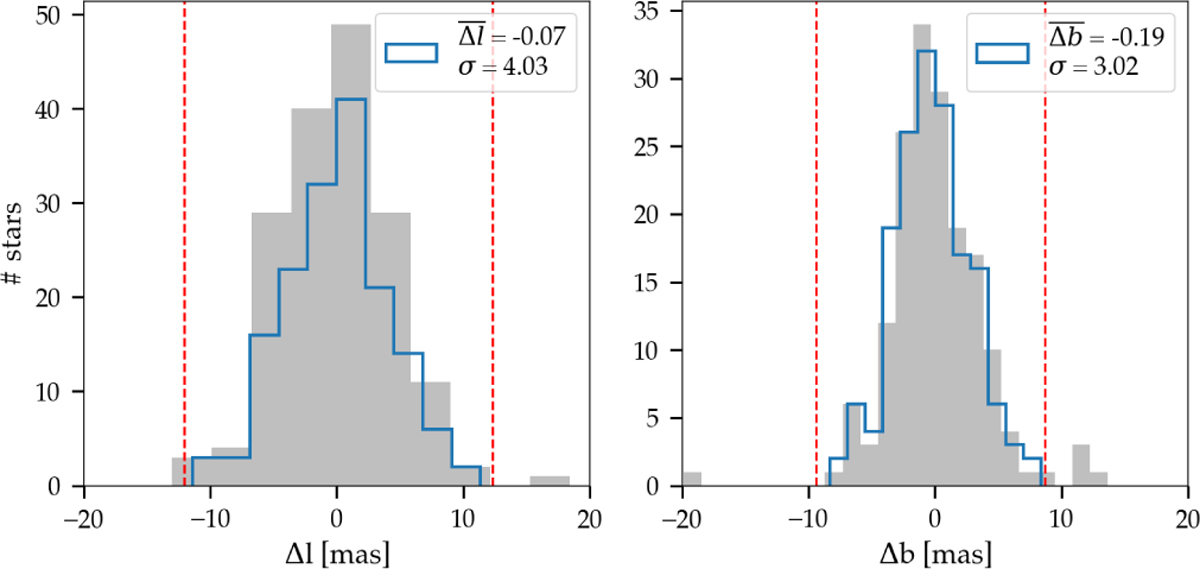
Position residuals in l and b between GNS I DR2 H band stars in the field B1 (Fig. 1) and Gaia DR3 stars in the same field. Blue histograms show the residual distribution after removing the 3σ outliers, while gray histograms show the full distribution before clipping. Dotted red lines indicate the 3σ thresholds.
Current usage metrics show cumulative count of Article Views (full-text article views including HTML views, PDF and ePub downloads, according to the available data) and Abstracts Views on Vision4Press platform.
Data correspond to usage on the plateform after 2015. The current usage metrics is available 48-96 hours after online publication and is updated daily on week days.
Initial download of the metrics may take a while.