Fig. 9
Download original image
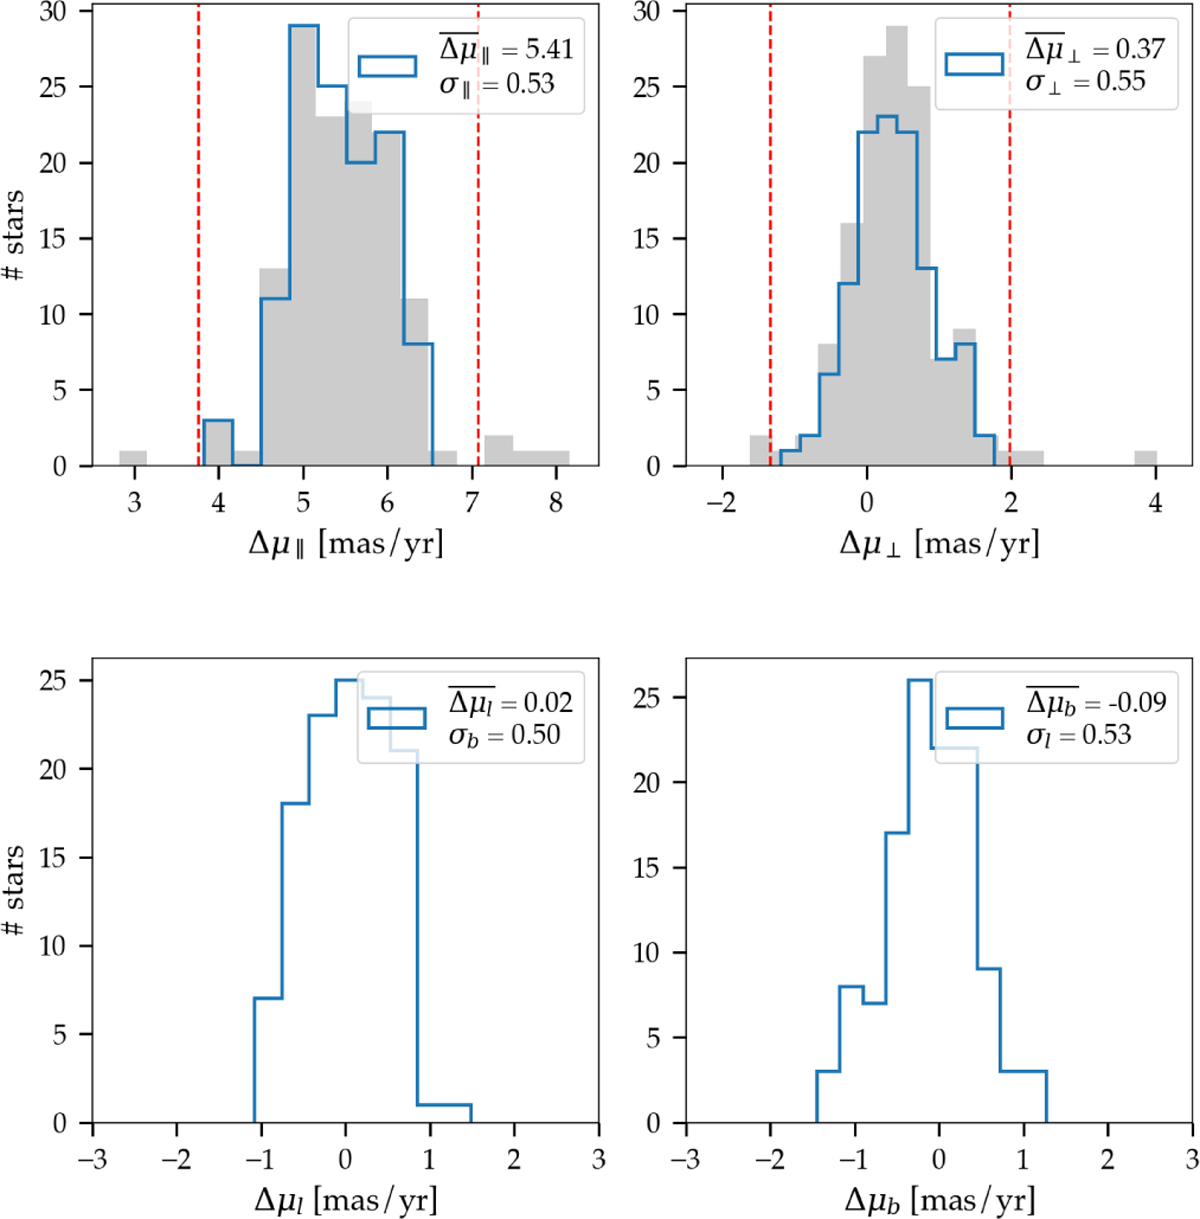
Gaia-GNS PM residuals for the Galactic bar field (green box in Fig. 1). Left panels: residuals of the parallel component. Right panels: residuals of the perpendicular component. Top: residuals of the relative PMs. Bottom: Residuals of the absolute PMs. Gray histograms show the full distribution before clipping, and blue histograms show the same but after removing the 3σ outliers. Dotted red lines indicate the 3σ thresholds.
Current usage metrics show cumulative count of Article Views (full-text article views including HTML views, PDF and ePub downloads, according to the available data) and Abstracts Views on Vision4Press platform.
Data correspond to usage on the plateform after 2015. The current usage metrics is available 48-96 hours after online publication and is updated daily on week days.
Initial download of the metrics may take a while.