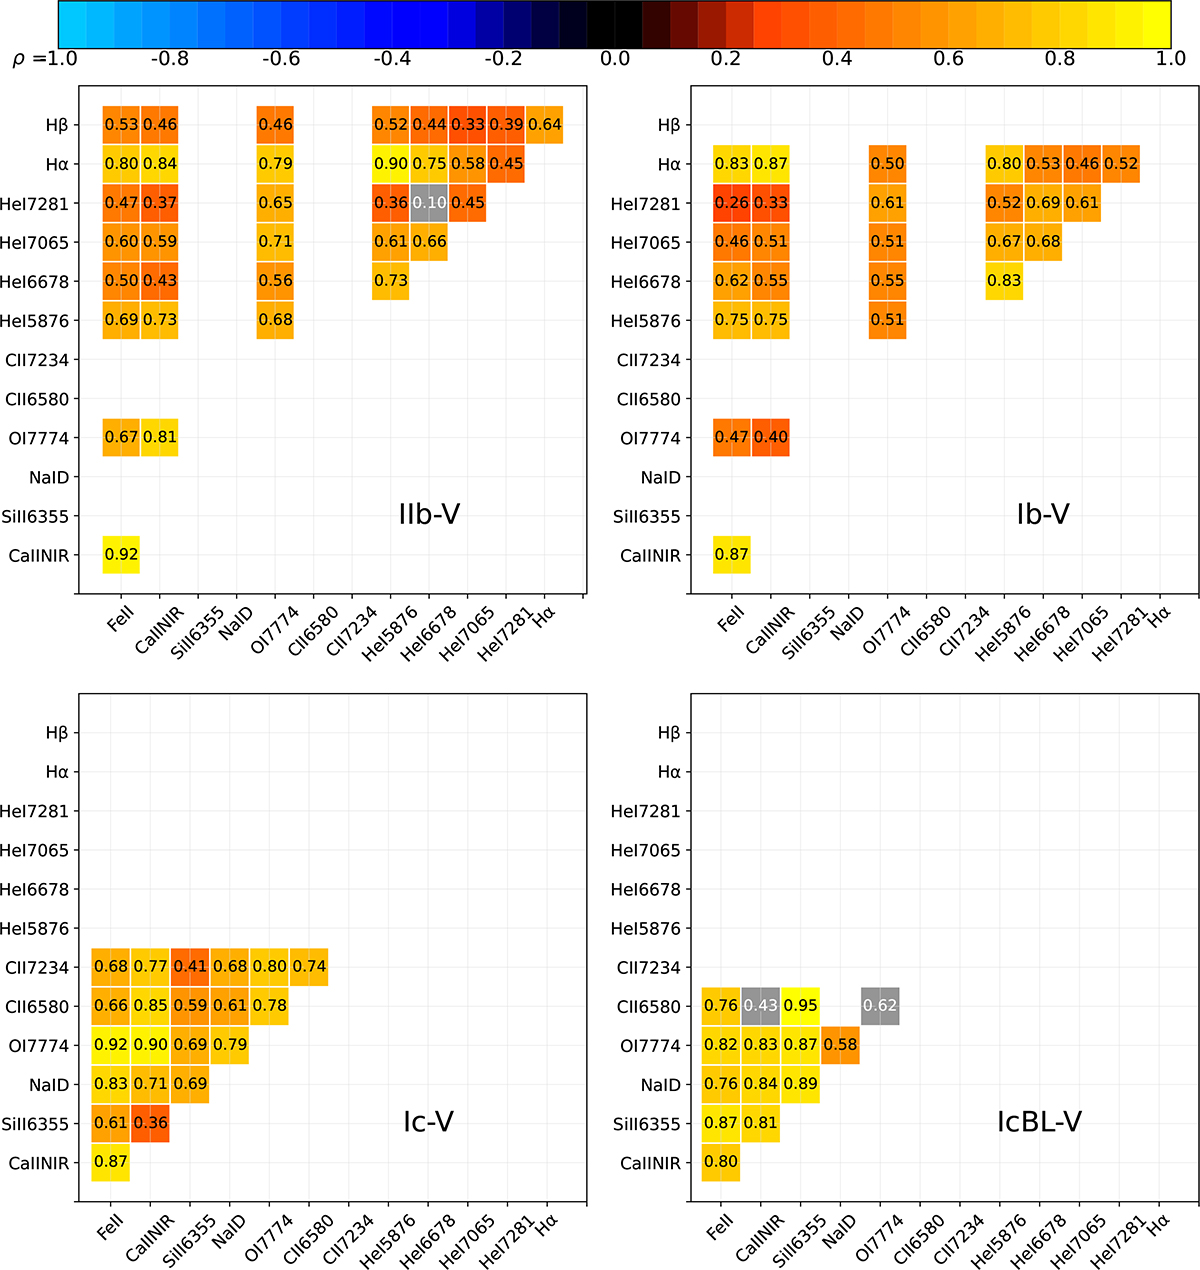
Fig. 12.
Download original image
Spearman’s rank correlation coefficients (ρ) between the measured velocities of lines of different types of SESNe. The ions are arranged such that lighter elements are positioned toward the right and top. The numbers in each box show the coefficients of the corresponding line pairs. Boxes in gray show low statistical significance with a p value higher than 0.05. These cases are all due to the very small dataset. The numeric values are indicated by the color bar at the top of the figure, with lighter colors indicating stronger correlation. Data behind the figure are available at the CDS.
Current usage metrics show cumulative count of Article Views (full-text article views including HTML views, PDF and ePub downloads, according to the available data) and Abstracts Views on Vision4Press platform.
Data correspond to usage on the plateform after 2015. The current usage metrics is available 48-96 hours after online publication and is updated daily on week days.
Initial download of the metrics may take a while.