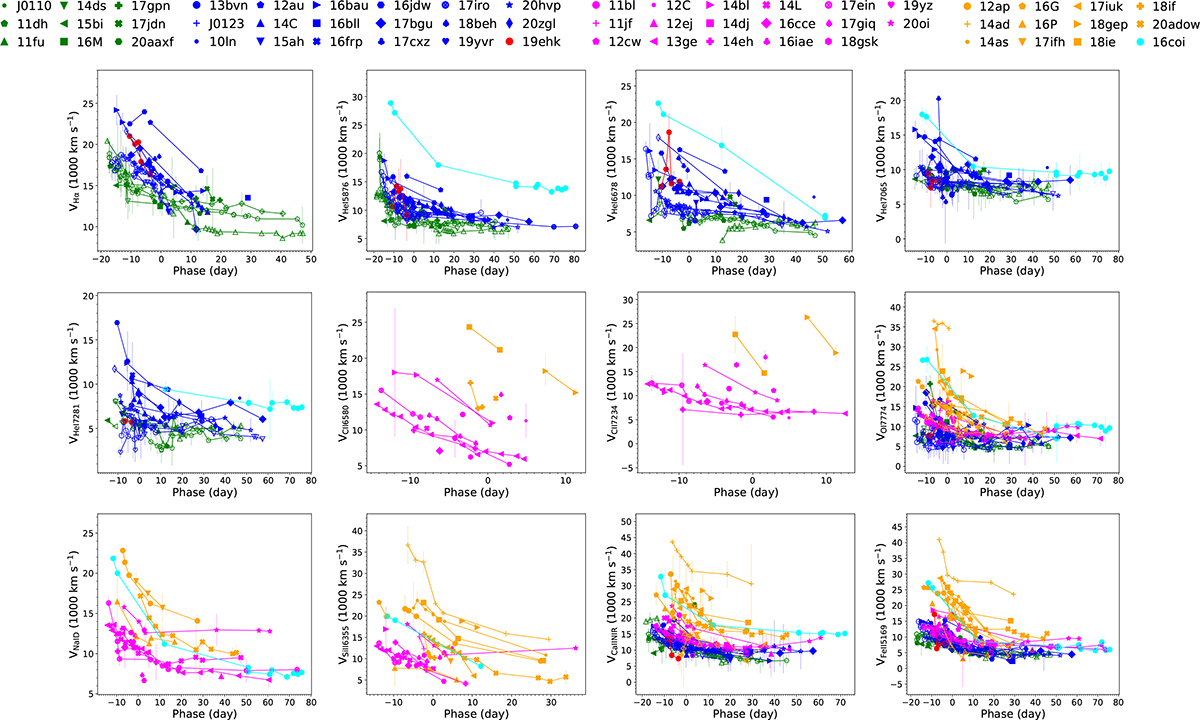
Fig. A.2.
Download original image
Evolution of line velocities of in the four subtypes of SESNe. In each figure, different subtypes are plotted in distinct colors: green–IIb, blue–Ib, magenta–Ic, orange–Ic-BL. The same supernovae are plotted with symbols shown in the top legend and connected by lines. SN 2016coi and SN 2019ehk are represented in red and cyan, respectively, as their spectral phenotypes differ from the four subclasses.
Current usage metrics show cumulative count of Article Views (full-text article views including HTML views, PDF and ePub downloads, according to the available data) and Abstracts Views on Vision4Press platform.
Data correspond to usage on the plateform after 2015. The current usage metrics is available 48-96 hours after online publication and is updated daily on week days.
Initial download of the metrics may take a while.