Open Access
Fig. 3.
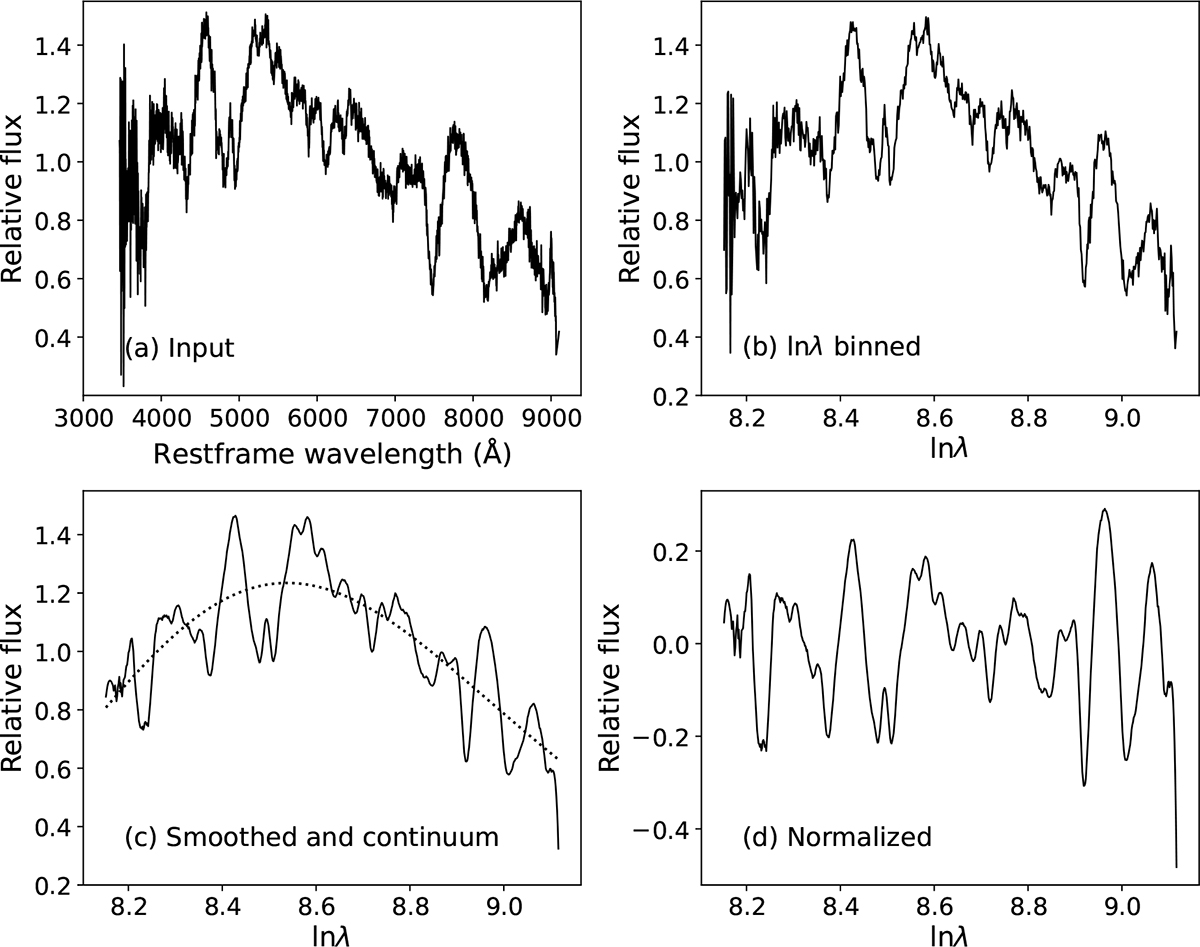
Download original image
Preprocessing method for our spectral data. (a) Input spectrum after corrections of redshift. (b) Spectrum after binning into logarithmic scale with dλln = 0.0015. (c) Smoothed spectrum with a window length of 21. The pseudo-continuum is plotted as a dotted line. (d) Spectrum normalized by dividing the continuum in (c).
Current usage metrics show cumulative count of Article Views (full-text article views including HTML views, PDF and ePub downloads, according to the available data) and Abstracts Views on Vision4Press platform.
Data correspond to usage on the plateform after 2015. The current usage metrics is available 48-96 hours after online publication and is updated daily on week days.
Initial download of the metrics may take a while.