Fig. 5.
Download original image
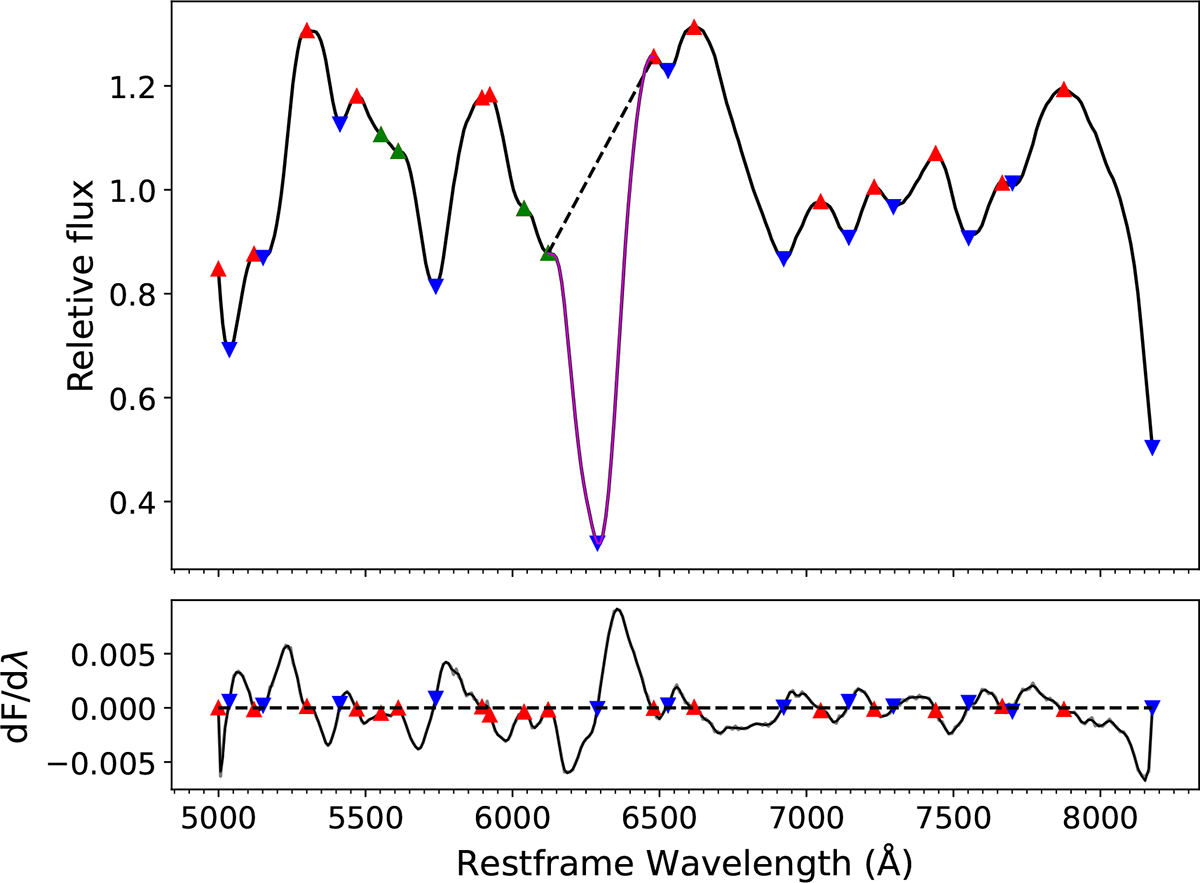
Schematic diagram illustrating the method of defining the spectral line range. For the smoothed spectrum (upper panel), the first derivative of flux with respect to wavelength is computed (lower panel). Local maxima and minima are identified where the sign of the derivative changes, marked with red upward-pointing and blue downward-pointing triangles, respectively. At certain wavelengths, distinct inflection points are observed where the derivative approaches zero without a sign change; these are indicated by green upward-pointing triangles. The wavelength range of the Hα line is thus delineated in purple, while the local pseudo-continuum is represented by the dashed black line.
Current usage metrics show cumulative count of Article Views (full-text article views including HTML views, PDF and ePub downloads, according to the available data) and Abstracts Views on Vision4Press platform.
Data correspond to usage on the plateform after 2015. The current usage metrics is available 48-96 hours after online publication and is updated daily on week days.
Initial download of the metrics may take a while.