Fig. 6.
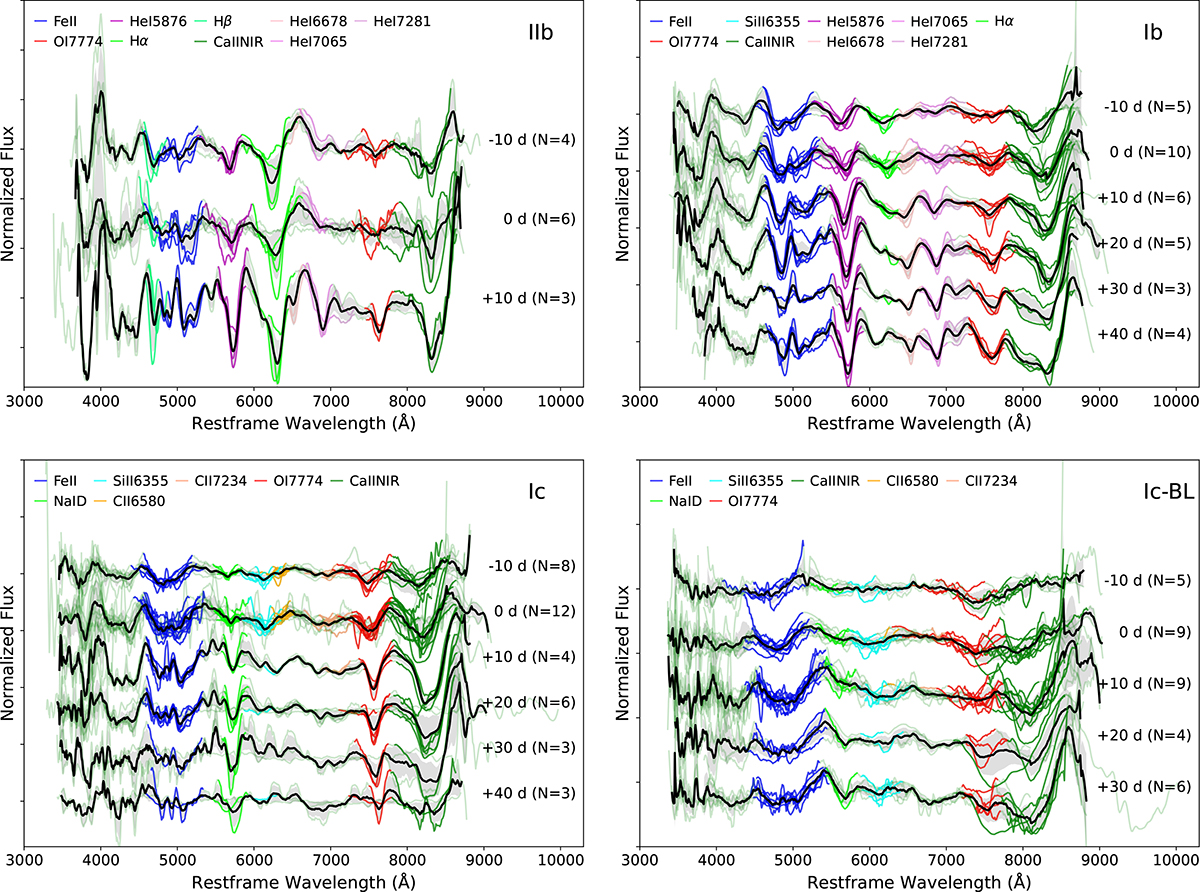
Download original image
Mean spectra and their corresponding standard deviations of different subtypes of SESNe at four different phases spanning from –10 to 40 days since V-band maximum. The numbers on the right side of each set of spectra are the corresponding phases, and number of spectra included to calculate the mean spectra is shown in the brackets. The mean spectra are shown by solid black lines, and the 1σ uncertainty is shown by shaded gray regions. Each single spectrum is plotted in light green. For each spectrum, the lines are marked by colors denoted at the top of each figure.
Current usage metrics show cumulative count of Article Views (full-text article views including HTML views, PDF and ePub downloads, according to the available data) and Abstracts Views on Vision4Press platform.
Data correspond to usage on the plateform after 2015. The current usage metrics is available 48-96 hours after online publication and is updated daily on week days.
Initial download of the metrics may take a while.