Fig. 9.
Download original image
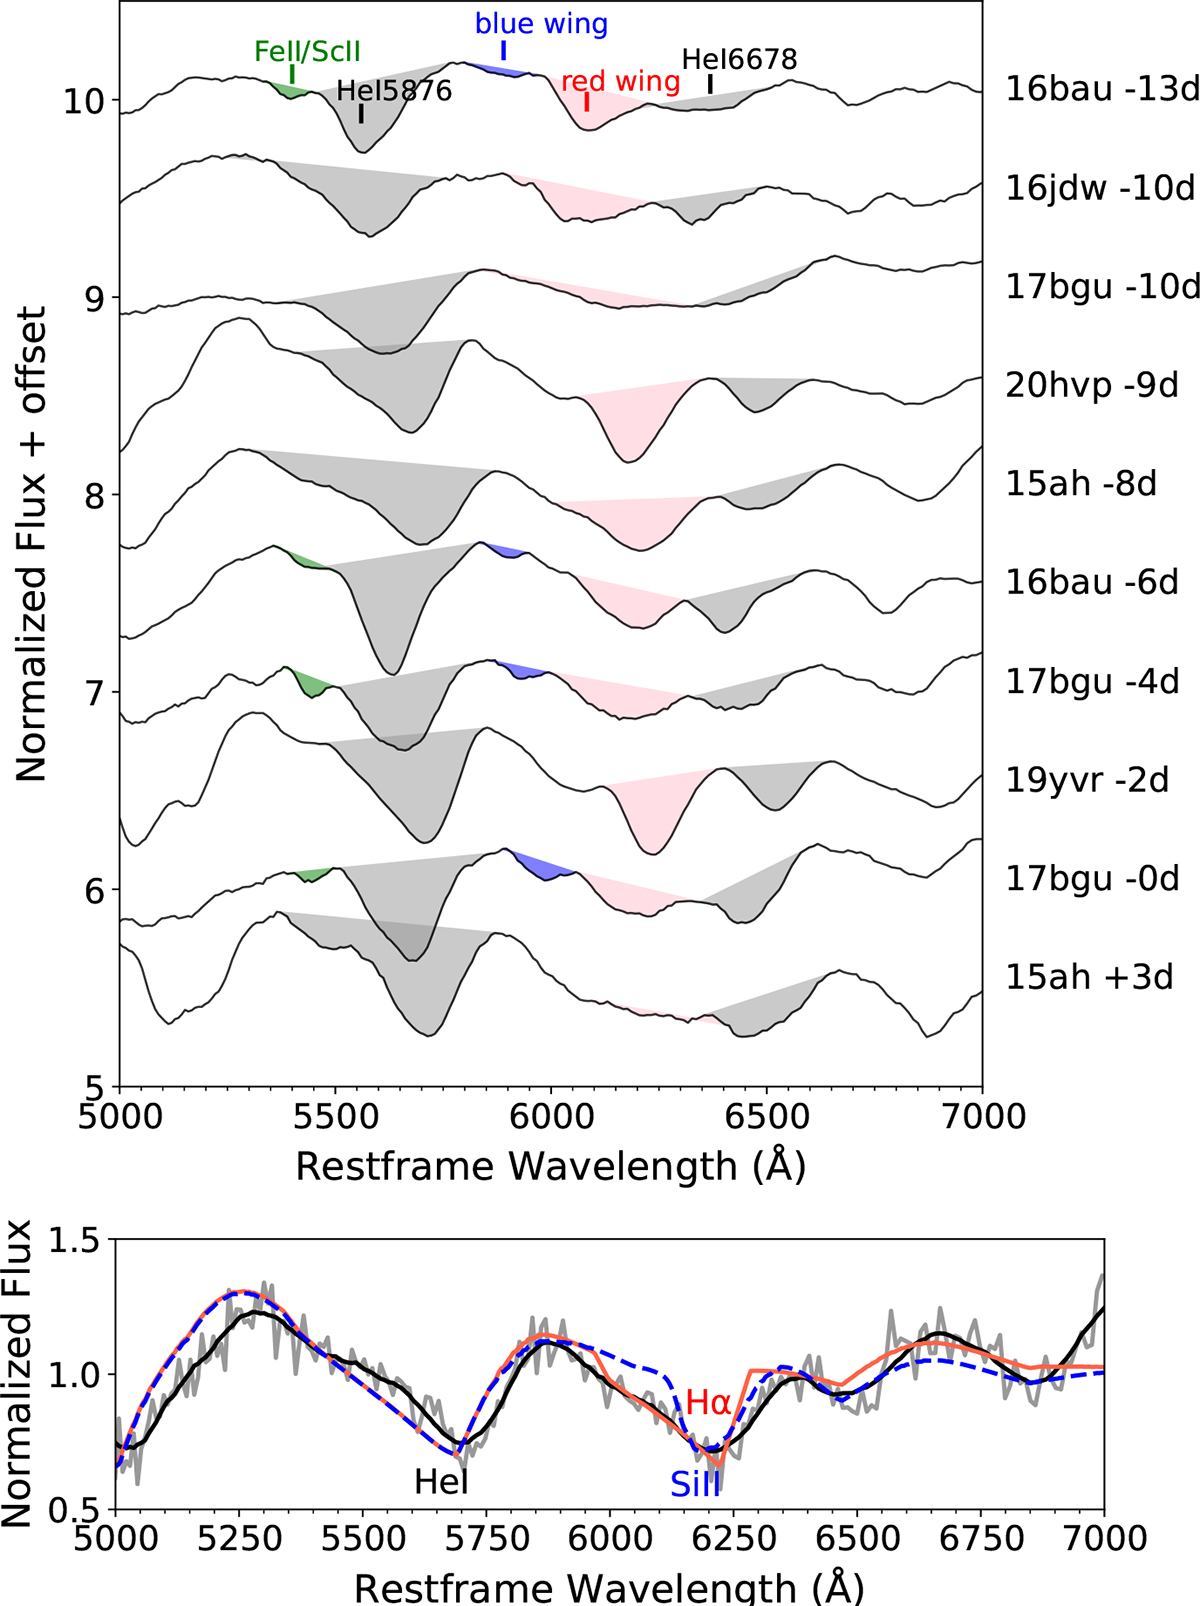
Upper: Normalized spectra of SNe Ib in our sample till maximum light in the range of 5000–7000 Å, showing the features around Hα. The spectra of different SNe are plotted in distinct colors and shifted vertically for better illustration. The main absorption features are highlighted with distinct colored shaded areas. The green bands in the areas denote an absorption line of ambiguous origin that appears concurrently with the blue-wing structure. Lower: Normalized spectrum of SN 2015ah at −8-d showing the range of the doublet feature near 6200 Å. Synthetic spectra by SYNOW with either HI (solid red line) or Si II (dashed blue line) are also overplotted.
Current usage metrics show cumulative count of Article Views (full-text article views including HTML views, PDF and ePub downloads, according to the available data) and Abstracts Views on Vision4Press platform.
Data correspond to usage on the plateform after 2015. The current usage metrics is available 48-96 hours after online publication and is updated daily on week days.
Initial download of the metrics may take a while.