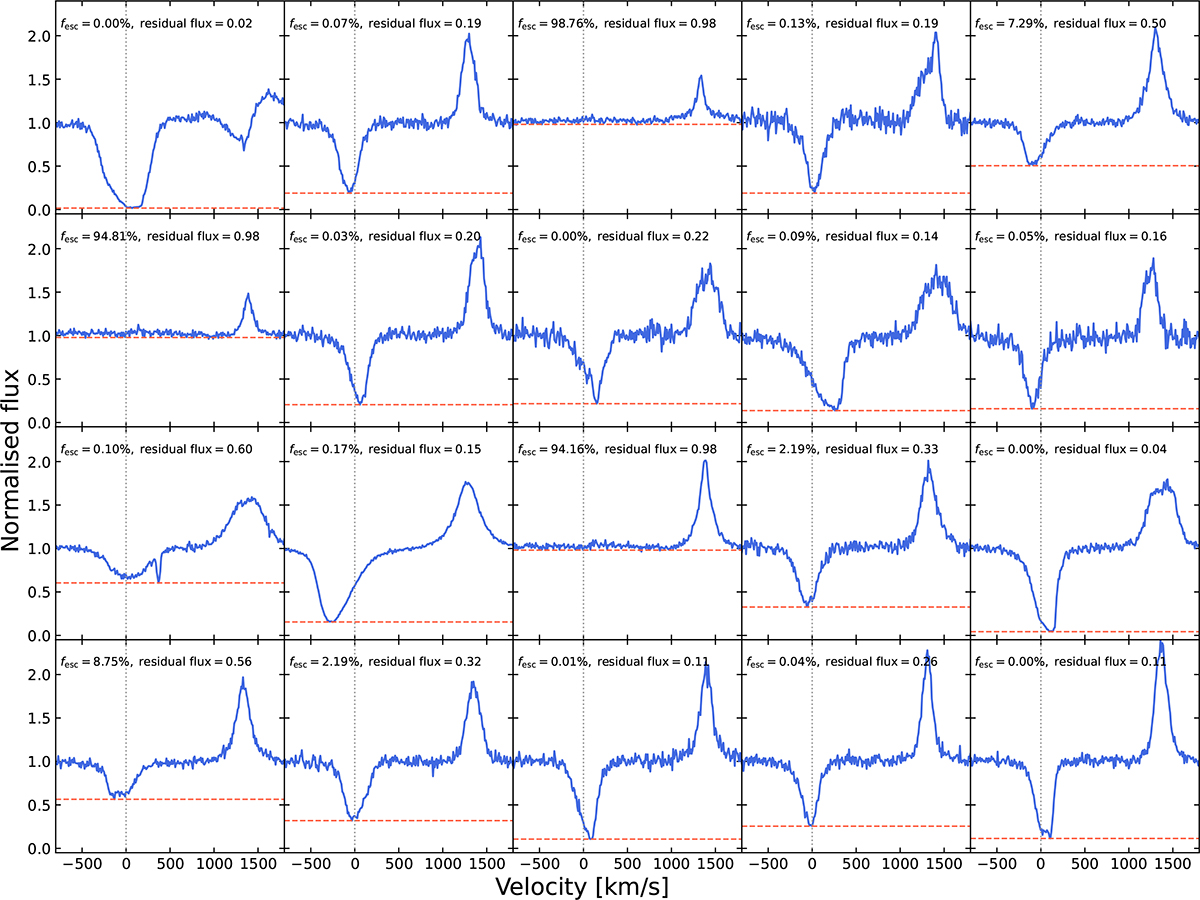
Fig. 2.
Download original image
Examples of Si II λ1526 absorption and fluorescent emission profiles drawn from different haloes and LOS among our seven simulation snapshots. The spectra were selected using KMeans clustering to span a diverse range of spectral properties, including the equivalent width of absorption, residual flux, velocity centroid, and fluorescence strength. Each panel shows the normalised spectrum (blue) along with a dashed horizontal line at the minimum flux level, and a vertical dotted grey line at line centre. The red line highlights the value of the residual flux, which is indicated at the top of each panel, along with the corresponding fesc.
Current usage metrics show cumulative count of Article Views (full-text article views including HTML views, PDF and ePub downloads, according to the available data) and Abstracts Views on Vision4Press platform.
Data correspond to usage on the plateform after 2015. The current usage metrics is available 48-96 hours after online publication and is updated daily on week days.
Initial download of the metrics may take a while.