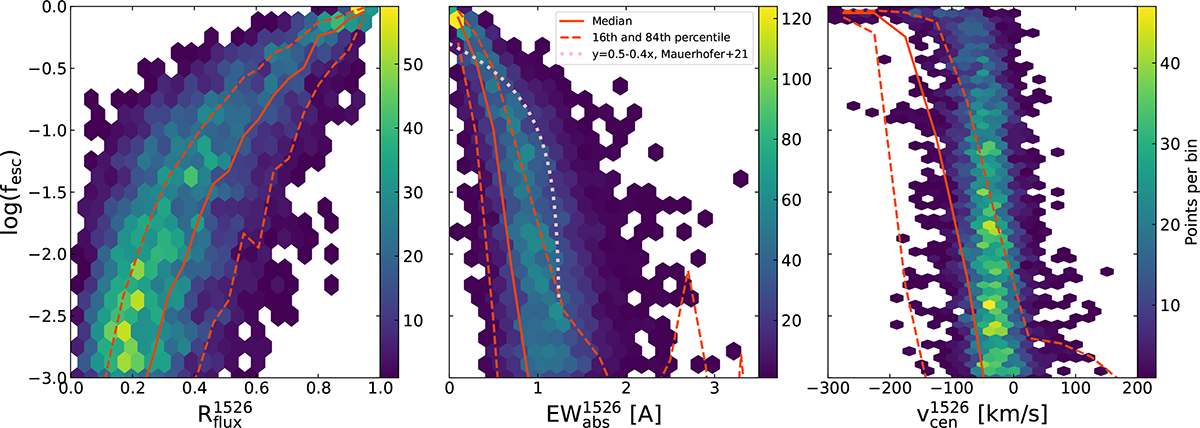
Fig. 4.
Download original image
Relations between the escape fraction of ionising photons and three Si II λ1526 properties. The solid lines show the running median, and the dashed lines show the 16th and 84th percentiles. These lines are affected by spectra with log(fesc) < − 3, which are not displayed here. The left and middle panels show the residual flux and equivalent width of the absorption line, respectively. The dotted pink line shows the upper limit found in M21. The right panel shows the centroid velocity of Si II λ1526.
Current usage metrics show cumulative count of Article Views (full-text article views including HTML views, PDF and ePub downloads, according to the available data) and Abstracts Views on Vision4Press platform.
Data correspond to usage on the plateform after 2015. The current usage metrics is available 48-96 hours after online publication and is updated daily on week days.
Initial download of the metrics may take a while.