Fig. 8.
Download original image
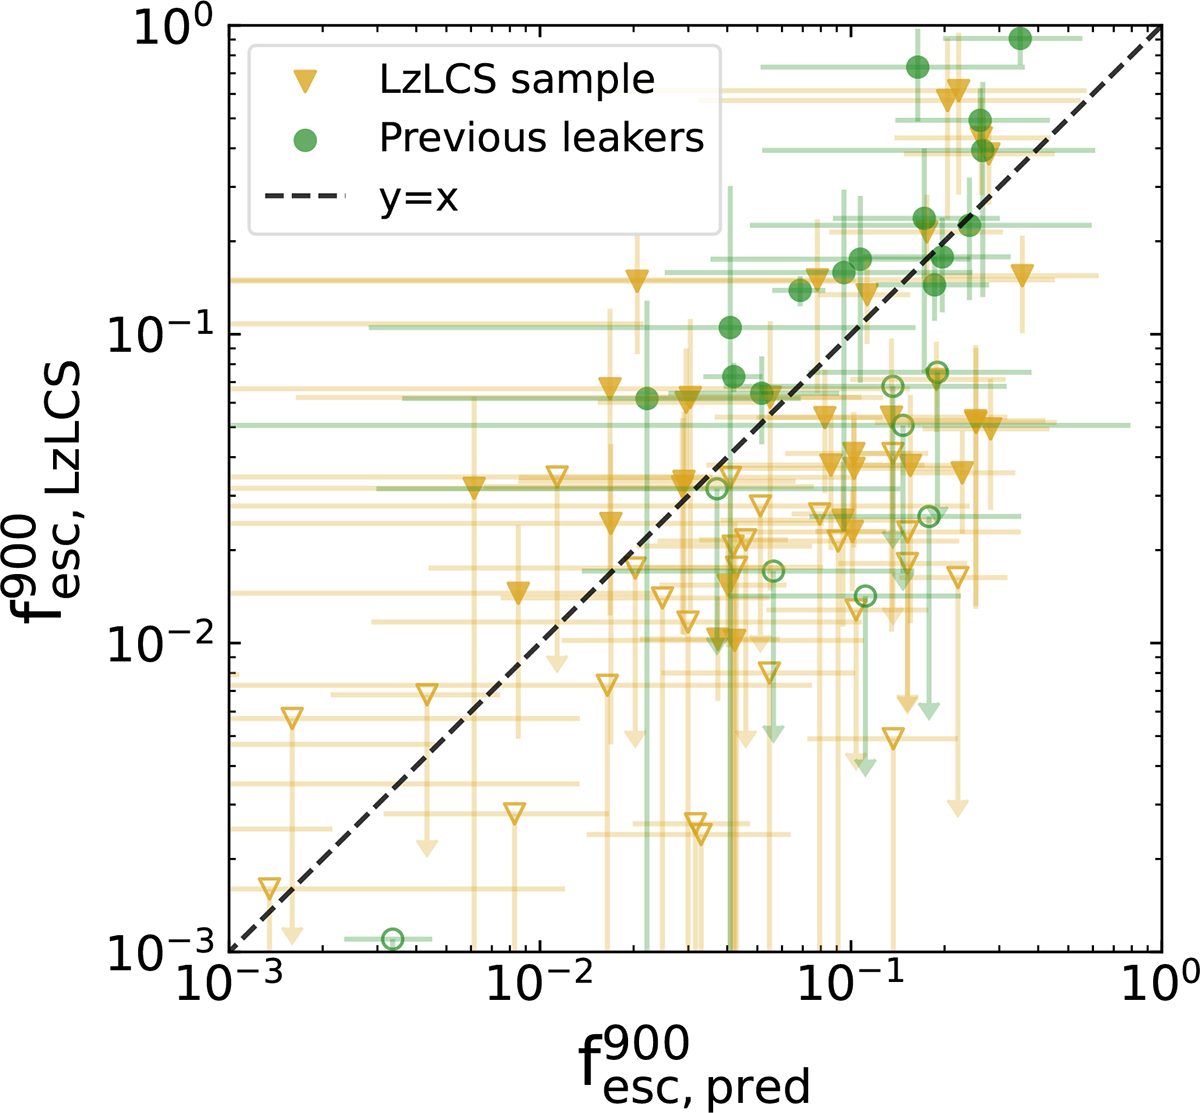
Comparison of Equation (7) applied to LzLCS residual fluxes and dust attenuations (x-axis) with ![]() estimated in Flury et al. (2022a) with the UV SED fesc method (y-axis). The yellow points correspond to galaxies from the LzLCS survey itself, while the green points correspond to leakers detected earlier (Izotov et al. 2016a,b, 2018, 2021; Wang et al. 2019). The upper limits are indicated with open symbols and downward arrows.
estimated in Flury et al. (2022a) with the UV SED fesc method (y-axis). The yellow points correspond to galaxies from the LzLCS survey itself, while the green points correspond to leakers detected earlier (Izotov et al. 2016a,b, 2018, 2021; Wang et al. 2019). The upper limits are indicated with open symbols and downward arrows.
Current usage metrics show cumulative count of Article Views (full-text article views including HTML views, PDF and ePub downloads, according to the available data) and Abstracts Views on Vision4Press platform.
Data correspond to usage on the plateform after 2015. The current usage metrics is available 48-96 hours after online publication and is updated daily on week days.
Initial download of the metrics may take a while.