Fig. 9.
Download original image
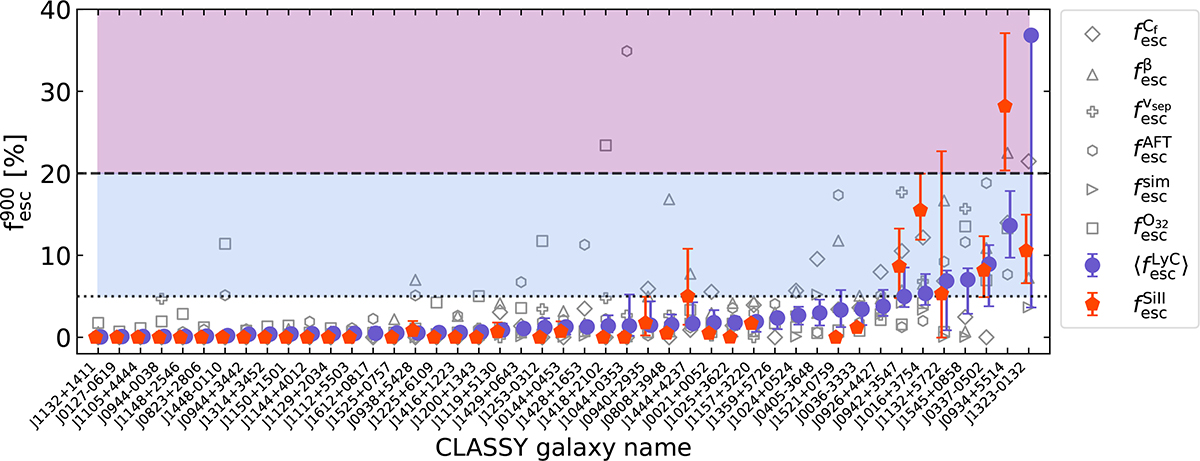
Comparison of our predictions of ![]() from Equation (7) with escape fractions inferred in Parker et al. (in prep.) for all CLASSY galaxies, listed on the x-axis. The open symbols represent the six methods with which
from Equation (7) with escape fractions inferred in Parker et al. (in prep.) for all CLASSY galaxies, listed on the x-axis. The open symbols represent the six methods with which ![]() was inferred from observations and which are detailed in Sect. 4.3.2. The purple dots show the median of the six measurements, and the red pentagons show our predictions. The shaded blue region represents weak leakers, as defined in Parker et al. (2026), and the shaded dark pink region represents strong leakers.
was inferred from observations and which are detailed in Sect. 4.3.2. The purple dots show the median of the six measurements, and the red pentagons show our predictions. The shaded blue region represents weak leakers, as defined in Parker et al. (2026), and the shaded dark pink region represents strong leakers.
Current usage metrics show cumulative count of Article Views (full-text article views including HTML views, PDF and ePub downloads, according to the available data) and Abstracts Views on Vision4Press platform.
Data correspond to usage on the plateform after 2015. The current usage metrics is available 48-96 hours after online publication and is updated daily on week days.
Initial download of the metrics may take a while.