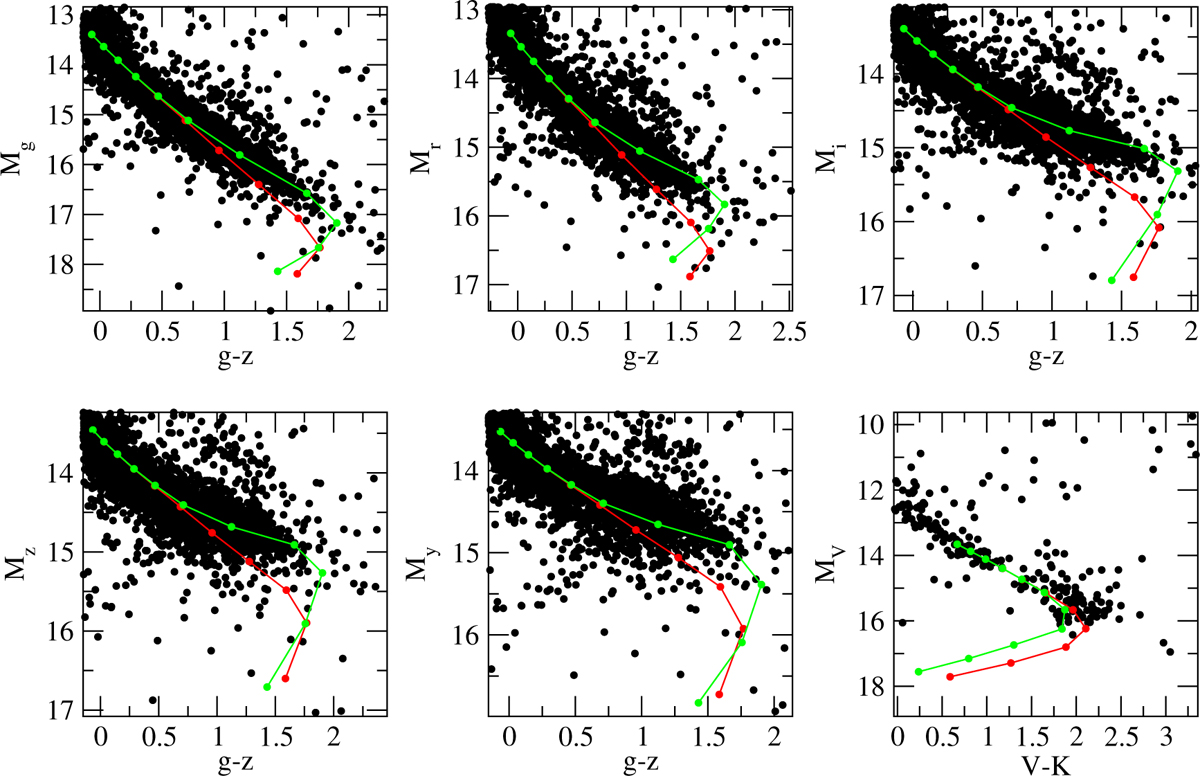
Fig. A.1
Download original image
H-R diagram for the sample of white dwarfs with PAN-STARRS nad BVK photometry (filled black dots; Dufour et al. 2017), pure hydrogen atmosphere cooling sequence of log g = 8 with (red dots and solid line) and without (green dots and solid line) H+3 species considered in the chemical equilibrium. Dots represent the effective temperature sequence from 8000 K to 3000 K, from top to bottom, with an interval of 500 K.
Current usage metrics show cumulative count of Article Views (full-text article views including HTML views, PDF and ePub downloads, according to the available data) and Abstracts Views on Vision4Press platform.
Data correspond to usage on the plateform after 2015. The current usage metrics is available 48-96 hours after online publication and is updated daily on week days.
Initial download of the metrics may take a while.