| Issue |
A&A
Volume 708, April 2026
|
|
|---|---|---|
| Article Number | A26 | |
| Number of page(s) | 7 | |
| Section | Stellar atmospheres | |
| DOI | https://doi.org/10.1051/0004-6361/202558312 | |
| Published online | 27 March 2026 | |
Complex hydrogen chemical equilibrium and Gaia low mass problem in cool white dwarfs
1
Institute of Energy Technologies - Theory and Computation of Energy Materials (IET-3),
Forschungszentrum Jülich GmbH,
52425
Jülich,
Germany
2
Jülich Aachen Research Alliance JARA Energy & Center for Simulation and Data Science (CSD),
52428
Jülich,
Germany
★ Corresponding author: This email address is being protected from spambots. You need JavaScript enabled to view it.
Received:
28
November
2025
Accepted:
4
February
2026
Abstract
Context. The extensive Gaia dataset reveals a substantial misfit between models and observation for cool white dwarfs with Teff < 6000 K, resulting in severe underestimations of their masses.
Aims. We aim to understand the underlying modeling issues related to this misfit.
Methods. We applied state-of-the-art atmosphere models to analyze the Gaia DR3 sample of white dwarfs, along with quantum mechanical calculations to quantify the formation and stability of different hydrogen species in the atmospheres of these stars.
Results. We find that we are able to reconcile the models and observations when we artificially suppress the formation of H+3 species, a process which substantially alters the chemical equilibrium at Teff < 6000 K, resulting in an overabundance of free electrons and H− and strengthening of H− bound-free absorption. Removing the H+3 species from chemical equilibrium considerations makes the ionization of hydrogen atoms the main source of free electrons, with the resulting models reproducing the Gaia white dwarfs cooling branch well. Because H+3 must form under the considered conditions, it is likely the overestimation of its partition function and the resulting abundance or the formation of H− (or another anionic species) that leads to the suppression of the H− formation as a countercharge for H+3 in current models.
Conclusions. The chemical equilibrium in hydrogen atmospheres of cool white dwarfs must be reconsidered with respect to the abundance of H+3 species and the presence of unaccounted charge species.
Key words: stars: atmospheres / white dwarfs
© The Authors 2026
 Open Access article, published by EDP Sciences, under the terms of the Creative Commons Attribution License (https://creativecommons.org/licenses/by/4.0), which permits unrestricted use, distribution, and reproduction in any medium, provided the original work is properly cited.
This article is published in open access under the Subscribe to Open model. This email address is being protected from spambots. You need JavaScript enabled to view it. to support open access publication.
1 Introduction
The large amount of data delivered by Gaia has put models of white dwarf stars to the test. Several studies published in the last three decades have established a large degree of confidence on the predictability of the spectra and photometries of hydrogen atmosphere stars representing the majority of white dwarfs (Kowalski & Saumon 2006; Kilic et al. 2009b,a, 2010; Giammichele et al. 2012; Durant et al. 2012; Kilic et al. 2012; Saumon et al. 2014; Blouin et al. 2019; Caron et al. 2023). In particular, after the introduction of hydrogen Lyman (Ly) α red wing opacity by Kowalski & Saumon (2006), the spectra of the majority of such stars could be well fitted, including stars at the cooler end (with Teff ~ 4000 K; e.g., Kilic et al. 2009a, 2010; Saumon et al. 2014; Durant et al. 2012). Nevertheless, although several thousands of white dwarfs have been successfully identified in Gaia data, allowing for the construction of a complete white dwarf Hertzsprung-Russell (H-R) diagram, all studies to date have shown a significant divergence between the models and the data in Gaia G versus GBP - GRP cooling track for stars with Teff below ~6000 K (e.g., Caron et al. 2023; O’Brien et al. 2024; Sahu et al. 2025). This discrepancy leads to a severe underestimation of the masses of cool stars by up to 0.2 M⊙, standing in the way of proper analyses of the cooling sequence in terms of certain properties, such as age (Sahu et al. 2025).
The majority of white dwarf stars, particularly cool objects, have hydrogen-dominated atmospheres with a minority of objects exhibiting helium-dominated atmospheres (Kowalski & Saumon 2006; Caron et al. 2023). While the more extreme helium atmosphere stars, with densities reaching the levels of dense fluid (up to a few g/cm3; Kowalski 2014; Saumon et al. 2022), represent a challenge to the modeling, as several dense fluid effects have to be accounted for (e.g., Kowalski & Saumon 2004; Kowalski 2006, 2014; Blouin et al. 2017), hydrogen atmospheres are less extreme and should be well described by the ideal gas physics and chemistry, as indicated by the good performance of models in the above-mentioned studies. Thus, the detection of a discrepancy between models and Gaia data comes as a surprise and a puzzle.
Some recent studies have attempted to tackle this problem, looking to inaccuracies in the description of main absorption mechanisms as a main cause. O’Brien et al. (2024) demonstrated that an ad hoc increase of Ly α opacity of Kowalski & Saumon (2006) by a factor of 5 could correct the mass problem, calling for a revision of the model of this absorption mechanism. While plausible, such a severe uncertainty in Ly α absorption would contradict the above-mentioned successful fits to several cool white dwarf stars. Nevertheless, Sahu et al. (2025) attempted a revision of this opacity mechanism, including the effects of multiple perturbers and the detailed angular dependence analysis of H2-He collisions. Although the resulting models did lead to some minor improvement in the performance of the models in describing Gaia data, the overall fits to the spectral energy distributions of individual stars were not improved over those using opacity of Kowalski & Saumon (2006). Most importantly, the Gaia mass problem persists. With the negative result, Sahu et al. (2025) speculated that the H− bound-free opacity may be overestimated by a factor of 5, pointing to uncertainty in this absorption mechanism as a potential source of the Gaia mass bias. We notice that this would be rather surprising, as the H− bound-free absorption is relatively straightforward to model, in comparison to Ly α opacity, and its computation has been a topic of early “classical” and very accurate computational studies (e.g., Chandrasekhar 1945; Chandrasekhar & Elbert 1958; Doughty et al. 1966). Nevertheless, the analysis of Sahu et al. (2025) showed that none of these ad hoc corrections could consistently reconcile models and data at H-R diagrams constructed with photometric bandpasses of different wavelengths.
To understand the true origin of the discrepancy between models and Gaia data, we undertook a detailed analysis of the models above and below Teff = 6000 K, with an aim to identify significant differences and correlate these with the Gaia mass problem. In particular, we considered chemical equilibrium, a key factor that has not been analyzed in the literature to date.
2 Computational approach
We used state-of-the-art white dwarf atmosphere models, which include essential absorption mechanisms, Ly α red wing opacity (Kowalski & Saumon 2006), and negative hydrogen ion bound-free absorption (John 1988). These models assume the presence of the following hydrogen species: H, H+, H2, H+2, H−, H+3, and free electrons. They have been successfully applied in reproduction of entire spectral energy distributions of several cool white dwarfs with hydrogen atmospheres (e.g., Kowalski & Saumon 2006; Kilic et al. 2008; Saumon et al. 2014). Because atmospheres of stars at the very cool end become condensed, we accounted for the refractive effects in the radiative transfer equation (Kowalski & Saumon 2004). The refractive index was estimated using Clausius-Mossotti relation (Rysselberghe 1932) with polarizabilities of hydrogen atoms and hydrogen molecules of 3.8 ∙ 10−25 cm2 and 8.2 ∙ 10−25 cm2, respectively. The quantum mechanical calculations were performed with the CPMD code1 using the density functional theory with the PBE (Perdew et al. 1996) approximation of the exchange-correlation functional. The Gaia sample of white dwarfs within 100 pc used in the analysis was taken from Jiménez-Esteban et al. (2022).
3 Results and discussion
In Fig. 1, we compare the cooling track of a hydrogen atmosphere white dwarf of surface gravity log g = 8 (cgs), corresponding to an average white dwarf of mass M ≈ 0.6 M⊙, with the Gaia data. The deviation between the model and data for Teff < 6000 K is clearly visible. The discrepancy between Gaia and synthetic magnitudes results in incorrect assignment of lower masses to stars at the end of the cooling track (O’Brien et al. 2024; Sahu et al. 2025).
To understand the origin of the discrepancy between the models and Gaia data, we checked the variation in the atmospheric abundance of different hydrogen species with the effective temperature. As illustrated in Fig. 2, for stars with Teff > 6000 K, the dominant species is atomic hydrogen, which is the main donor of free electrons that determine the abundance of the negative hydrogen ion. For Teff < 6000 K, molecular hydrogen forms in large quantities, contributing to the collision induced absorption (CIA) in the infrared (Saumon et al. 2022). Interestingly, together with the rise in the abundance of molecular hydrogen, the ionization equilibrium becomes affected by the formation of the H3+ species; having the lowest formation energy among the considered cations (Table 1), they become the most abundant positively charged species, significantly altering the abundance of free electrons and H− species. Furthermore, the deviation between the models and the Gaia data is clearly correlated with the formation of the H3+ species.
To check the impact of H3+ formation on synthetic spectra and Gaia magnitudes, we computed models with suppressed abundance of this species. The resulting chemical equilibrium at Teff < 6000 K is drastically different, becoming governed by the ionization of H atoms, with some influence coming from the H+2 species, leading to a significant decrease in the abundance of free electrons and H−. The resulting cooling sequence overlaps with the Gaia data (Fig. 1; and with other data: Fig. A.1), strongly suggesting that the formation of H+3 species is the main cause of mismatch between the models and the data. The suppression of H+3 formation leads to significant decrease in the strength of H− bound-free opacity, which depends on the number of absorbing H− species. We notice that this decrease grows monotonically with decreasing Teff values, producing a gradual effect starting below 6000 K. The overall effect is qualitatively different from the case of applying a constant change to the strength of the absorption (Sahu et al. 2025). Although the simple modification of the chemical equilibrium by forbidding formation of H+3 species already reconciles the models and the data, reasoning for it requires better understanding.
It is the ionization energy of species such as H, H2, and the formation energy of H+3 that determine the ionization equilibrium and the resulting number of free electrons and H−. In Table 1, we provide the known, measured values of formation energies of these species. As mentioned above, the H+3 species has the lowest formation energy among cations and, once formed, it has to significantly contribute to the ionization equilibrium. It is also a known hydrogen species detected in astronomical objects (Miller et al. 2020) with a well-constrained formation energy (Ruscic et al. 2004, 2005). Thus, a simple exclusion of its formation is not a plausible solution.
Compared to the other hydrogen species, the description of thermodynamic parameters of H+3 is a challenge. Its partition function estimates (to which the abundance of H+3 species is directly proportional) for T > 1000 K vary by at least an order of magnitude between different studies (Neale & Tennyson 1995; Kylänpää & Rantala 2011 ; Chandra et al. 1991; Miller et al. 2010) and, in current models, the upper values of Neale & Tennyson (1995) are used. One plausible solution to the overabundance of H+3 species is thus overestimation of its partition function. Indeed, the partition function of Kylänpää & Rantala (2011) obtained with the advanced path integral Monte Carlo simulations, being by factor of ∼12 lower, results in much lower abundance of H+3 and H−, offering a better match of the models to the Gaia data (Figs. B.1 and C.1).
Assuming that H+3 forms as the chemical equilibrium predicts, there is the possibility that there could be another anionic species that has gone unaccounted for, which would compensate for the excess positive charge caused by the appearance of H+3, preventing the formation of additional electrons (and, indirectly, H−). One natural candidate would be H−, which may form with the decrease in the effective temperature due to the increased number of molecular species. The existence of this species has been reported in some studies (Jordon-Thaden et al. 2011), although as a metastable species, with the measured and computed here formation energy provided in Table 1. We note that the measured value indicates that it should be still H− to form as a counter charge to the H+3 formation. On the other hand, the computed formation energy is significantly smaller (also bearing in mind the uncertainty of DFT) and just slightly larger than the energy of H2 , which makes plausible that this anion species is more stable than measured. In Fig. 2, we demonstrate that when we decrease the formation energy further by 2.4 eV, such an anion becomes dominant, making H+3 ineffective in forming free electrons. The resulting ionization equilibrium, atmosphere models and the cooling track should be indistinguishable from the ones produced by suppressing H+3 formation. The same effect is expected when another hydrogen-based anion forms (e.g., H−), which our calculations suggest may be indeed preferred to form over a pair of H2 + H−, although by only 0.06 eV (Table 1). We note that the formation energy of H3 is not reported in the main databases (Ruscic et al. 2004, 2005) but existing computational data suggest that it is chemically bounded (Belyaev et al. 2006). Because of an already complex hydrogen chemical equilibrium at Teff < 6000 K shown by the models, there is also a possibility that more complex and exotic hydrogen species form, affecting the chemical and ionization equilibrium (Tennyson & Miller 2019). Quantifying these would require accurate quantum mechanical calculations of a series of such possible species as well as derivation of the thermodynamic parameters of H−, which is a challenging task, as the case of H+3 shows. We hope this study will trigger such an effort.
Sahu et al. (2025) speculated that it is the nonideal effects in a dense atmosphere that contribute to a potential distortion of the H− opacity. To check whether such a scenario is likely, we plot the photospheric density profiles and refractive index as a function of the effective temperature in Fig. 3. Indeed, although the density is still rather low (<< 0.1 g/cm3), the nonideal effects may play a role, but at the very cool end (Teff << 5000 K), which is illustrated by an increase of the refractive index. The previous estimates show that the ionization energy of H−, as a descriptor of perturbation in a dense medium, could be affected, but only when densities exceed 0.1 g/cm3 (Kowalski 2010), much higher values than those encountered in cool, hydrogen atmospheres of white dwarfs (Fig. 3).
Another intriguing possibility is that the ionization equilibrium, namely number of free electrons, is somehow determined by the most abundant species only, hydrogen atom and molecule, through direct ionization. This will exclude formation of trace species, such as H+3, from affecting the abundance of free electrons and H−. We note that this speculative assumption would indicate a non-equilibrium process taking place. However, if present for any reason, it may also affect chemical equilibrium and ionization fraction in more extreme and challenging to model, helium-rich atmospheres (Kowalski et al. 2007).
Nevertheless, we note that the cooling track obtained by removing H+3 from chemical equilibrium not only follows the Gaia data well, but also indicates the abrupt of the cooling track at the effective temperature of just below 4000 K. This is consistent with previous estimates of the effective temperature of white dwarfs at the end of the cooling sequence observed in the Galactic Disk (e.g., Kowalski 2007).
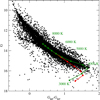 |
Fig. 1 H-R diagram for the 100 pc sample of white dwarfs: Gaia DR3 data (filled black dots; Jiménez-Esteban et al. 2022), pure hydrogen atmosphere cooling sequence of log g = 8 with (red dots and solid line) and without (green dots and solid line) H3+ species considered in the chemical equilibrium. Dots represent the effective temperature sequence from 8000 K to 3000 K (top to bottom) with an interval of 500K. |
Computed and measured (Ruscic et al. 2004, 2005) formation energy (enthalpy) of different hydrogen species.
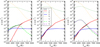 |
Fig. 2 Photospheric (at the Rosseland mean optical depth, τR = 2/3) abundance of species in the atmosphere of hydrogen white dwarf of log g = 8 as a function of the effective temperature. Different colors and lines represent different species as indicated in the legend insert. The panels show results with (left) and without (middle) H+3 species considered. The right panel shows the result obtained by assuming formation of a hypothetical anionic species (represented by H+2 with the decreased formation energy). |
4 Conclusions
We found here that the Gaia mass problem for cool white dwarfs shows a strong correlation with the dramatic change in the chemical-ionization equilibrium in hydrogen atmosphere of these stars. The white dwarf atmosphere models can be reconciled with Gaia data when the impact of H+3 ion on the ionization equilibrium is suppressed and the number of free electrons is governed by the most abundant species, namely hydrogen atoms. Assuming expected formation of H+3 species, this may indicate overestimation of the partition function of H+3 and its abundance, a missing anionic species unaccounted for by the models (for instance H−), or that ionization equilibrium is somehow determined by the dominant species. Independently of which mechanism is realised, Gaia data call for the reconsideration of models of chemical equilibrium applied in the modeling of cool white dwarfs atmospheres.
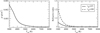 |
Fig. 3 Photospheric (at the Rosseland mean optical depth, τR = 2/3) density (left panel) and refractive index at τR = 2/3 and 100 (right panel), as a function of the effective temperature. |
Acknowledgements
The author gratefully acknowledges the computing time granted on the supercomputer JURECA at Forschungszentrum Jülich (Project cjiek61).
References
- Belyaev, A., Tiukanov, A., & Domcke, W. 2006, Chem. Phys., 325, 378 [Google Scholar]
- Blouin, S., Kowalski, P. M., & Dufour, P. 2017, ApJ, 848, 36 [Google Scholar]
- Blouin, S., Dufour, P., Thibeault, C., & Allard, N. F. 2019, ApJ, 878, 63 [NASA ADS] [CrossRef] [Google Scholar]
- Caron, A., Bergeron, P., Blouin, S., & Leggett, S. K. 2023, MNRAS, 519, 4529 [NASA ADS] [CrossRef] [Google Scholar]
- Chandra, S., Gaur, V., & Pande, M. 1991, JQSRT, 45, 57 [Google Scholar]
- Chandrasekhar, S. 1945, ApJ, 102, 223 [Google Scholar]
- Chandrasekhar, S., & Elbert, D. D. 1958, ApJ, 128, 633 [Google Scholar]
- Doughty, N. A., Fraser, P. A., & McEachran, R. P. 1966, MNRAS, 132, 255 [NASA ADS] [CrossRef] [Google Scholar]
- Dufour, P., Blouin, S., Coutu, S., et al. 2017, in Astronomical Society of the Pacific Conference Series, 509, 20th European White Dwarf Workshop, eds. P. E. Tremblay, B. Gaensicke, & T. Marsh, 3 [Google Scholar]
- Durant, M., Kargaltsev, O., Pavlov, G. G., et al. 2012, ApJ, 746, 6 [Google Scholar]
- Giammichele, N., Bergeron, P., & Dufour, P. 2012, ApJS, 199, 29 [Google Scholar]
- Jiménez-Esteban, F. M., Torres, S., Rebassa-Mansergas, A., et al. 2022, MNRAS, 518, 5106 [CrossRef] [Google Scholar]
- John, T. L. 1988, A&A, 193, 189 [NASA ADS] [Google Scholar]
- Jordon-Thaden, B., Kreckel, H., Golser, R., et al. 2011, Phys. Rev. Lett., 107, 193003 [Google Scholar]
- Kilic, M., Kowalski, P. M., Mullally, F., Reach, W. T., & von Hippel, T. 2008, ApJ, 678, 1298 [Google Scholar]
- Kilic, M., Kowalski, P. M., Reach, W. T., & von Hippel, T. 2009a, ApJ, 696, 2094 [Google Scholar]
- Kilic, M., Kowalski, P. M., & von Hippel, T. 2009b, AJ, 138, 102 [Google Scholar]
- Kilic, M., Munn, J. A., Williams, K. A., et al. 2010, ApJ, 715, L21 [Google Scholar]
- Kilic, M., Thorstensen, J. R., Kowalski, P. M., & Andrews, J. 2012, MNRAS, 423, L132 [Google Scholar]
- Kowalski, P. M. 2006, ApJ, 641, 488 [Google Scholar]
- Kowalski, P. M. 2007, A&A, 474, 491 [NASA ADS] [CrossRef] [EDP Sciences] [Google Scholar]
- Kowalski, P. M. 2010, AIP Conf. Proc., 1273, 424 [Google Scholar]
- Kowalski, P. M. 2014, A&A, 566, L8 [NASA ADS] [CrossRef] [EDP Sciences] [Google Scholar]
- Kowalski, P. M., & Saumon, D. 2004, ApJ, 607, 970 [Google Scholar]
- Kowalski, P. M., & Saumon, D. 2006, ApJ, 651, L137 [Google Scholar]
- Kowalski, P. M., Mazevet, S., Saumon, D., & Challacombe, M. 2007, Phys. Rev. B, 76, 075112 [Google Scholar]
- Kylänpää, I., & Rantala, T. T. 2011, J. Chem. Phys., 135, 104310 [Google Scholar]
- Miller, S., Stallard, T., Melin, H., & Tennyson, J. 2010, Faraday Discuss., 147, 283 [Google Scholar]
- Miller, S., Tennyson, J., Geballe, T. R., & Stallard, T. 2020, Rev. Mod. Phys., 92, 035003 [NASA ADS] [CrossRef] [Google Scholar]
- Neale, L., & Tennyson, J. 1995, ApJ, 454, L169 [Google Scholar]
- O’Brien, M. W., Tremblay, P.-E., Klein, B. L., et al. 2024, MNRAS, 527, 8687 [Google Scholar]
- Perdew, J. P., Burke, K., & Ernzerhof, M. 1996, Phys. Rev. Lett., 77, 3865 [CrossRef] [PubMed] [Google Scholar]
- Ruscic, B., Pinzon, R. E., Morton, M. L., et al. 2004, J. Phys. Chem. A., 108, 9979 [Google Scholar]
- Ruscic, B., Pinzon, R. E., von Laszewski, G., et al. 2005, J. Phys. Conf. Ser., 16, 561 [Google Scholar]
- Rysselberghe, P. V. 1932, J. Phys. Chem. A., 36, 1152 [Google Scholar]
- Sahu, S., Tremblay, P.-E., Koester, D., et al. 2025, MNRAS, 544, 2038 [Google Scholar]
- Saumon, D., Holberg, J. B., & Kowalski, P. M. 2014, ApJ, 790, 50 [Google Scholar]
- Saumon, D., Blouin, S., & Tremblay, P.-E. 2022, Phys. Rep., 988, 1 [NASA ADS] [CrossRef] [Google Scholar]
- Tennyson, J., & Miller, S. 2019, Philos. Trans. Roy. Soc. A Math. Phys. Eng. Sci., 377, 20180395 [Google Scholar]
Appendix A Supplementary magnitude-color diagrams
As the supplementary information we present a set of complementary figures. These were created using data from Montreal White Dwarf Database2 (Dufour et al. 2017).
In Fig. A.1 we present series of magnitude-color diagrams produced with PAN-STARRS and BVK photometry data. This figure is supplementary to Fig. 1 presented in the main text.
Appendix B The Hertzsprung-Russell diagram with the alternative partition function of H+3
In Fig. B.1 we present the reproduction of Fig. 1 with the additional cooling sequence modeled with the H+3 partition function of Kylänpää & Rantala (2011). We note that this sequence results in the improved match to the Gaia data, especially for Teff > 5000K.
Appendix C The abundances of species obtained with the alternative partition function of H+3
In Fig. C.1 we provide the atmospheric abundances of species computed assuming the H+3 partition function of Kylänpää & Rantala (2011).
Appendix D Pure-H atmosphere models
In Fig. D.1 we present series of synthetic, pure-H atmosphere models computed with and without H+3 species. The models show influence of H+3 suppression for Teff < 6000 K.
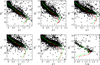 |
Fig. A.1 H-R diagram for the sample of white dwarfs with PAN-STARRS nad BVK photometry (filled black dots; Dufour et al. 2017), pure hydrogen atmosphere cooling sequence of log g = 8 with (red dots and solid line) and without (green dots and solid line) H+3 species considered in the chemical equilibrium. Dots represent the effective temperature sequence from 8000 K to 3000 K, from top to bottom, with an interval of 500 K. |
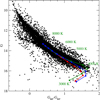 |
Fig. B.1 H-R diagram. Data and models as in Fig. 1.. The blue line and filled dots represent the cooling sequence computed assuming H+3 partition function of Kylänpää & Rantala (2011). |
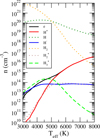 |
Fig. C.1 Photospheric (at the Rosseland mean optical depth, τR = 2/3) abundance of species in the atmosphere of hydrogen white dwarf of log g = 8 as a function of the effective temperature, obtained assuming the H+3 partition function of Kylänpää & Rantala (2011). |
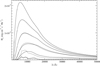 |
Fig. D.1 Sequence of synthetic pure-H atmosphere models with (solid lines) and without (dashed lines) H+3 species considered. The models represent the effective temperature sequence from 8000 K to 3000 K, from top to bottom, with an interval of 1000 K. Weak hydrogen lines present in the hotter atmospheres are removed for better visibility of spectral energy distributions. |
All Tables
Computed and measured (Ruscic et al. 2004, 2005) formation energy (enthalpy) of different hydrogen species.
All Figures
|
Fig. 1 H-R diagram for the 100 pc sample of white dwarfs: Gaia DR3 data (filled black dots; Jiménez-Esteban et al. 2022), pure hydrogen atmosphere cooling sequence of log g = 8 with (red dots and solid line) and without (green dots and solid line) H3+ species considered in the chemical equilibrium. Dots represent the effective temperature sequence from 8000 K to 3000 K (top to bottom) with an interval of 500K. |
| In the text | |
|
Fig. 2 Photospheric (at the Rosseland mean optical depth, τR = 2/3) abundance of species in the atmosphere of hydrogen white dwarf of log g = 8 as a function of the effective temperature. Different colors and lines represent different species as indicated in the legend insert. The panels show results with (left) and without (middle) H+3 species considered. The right panel shows the result obtained by assuming formation of a hypothetical anionic species (represented by H+2 with the decreased formation energy). |
| In the text | |
|
Fig. 3 Photospheric (at the Rosseland mean optical depth, τR = 2/3) density (left panel) and refractive index at τR = 2/3 and 100 (right panel), as a function of the effective temperature. |
| In the text | |
|
Fig. A.1 H-R diagram for the sample of white dwarfs with PAN-STARRS nad BVK photometry (filled black dots; Dufour et al. 2017), pure hydrogen atmosphere cooling sequence of log g = 8 with (red dots and solid line) and without (green dots and solid line) H+3 species considered in the chemical equilibrium. Dots represent the effective temperature sequence from 8000 K to 3000 K, from top to bottom, with an interval of 500 K. |
| In the text | |
|
Fig. B.1 H-R diagram. Data and models as in Fig. 1.. The blue line and filled dots represent the cooling sequence computed assuming H+3 partition function of Kylänpää & Rantala (2011). |
| In the text | |
|
Fig. C.1 Photospheric (at the Rosseland mean optical depth, τR = 2/3) abundance of species in the atmosphere of hydrogen white dwarf of log g = 8 as a function of the effective temperature, obtained assuming the H+3 partition function of Kylänpää & Rantala (2011). |
| In the text | |
|
Fig. D.1 Sequence of synthetic pure-H atmosphere models with (solid lines) and without (dashed lines) H+3 species considered. The models represent the effective temperature sequence from 8000 K to 3000 K, from top to bottom, with an interval of 1000 K. Weak hydrogen lines present in the hotter atmospheres are removed for better visibility of spectral energy distributions. |
| In the text | |
Current usage metrics show cumulative count of Article Views (full-text article views including HTML views, PDF and ePub downloads, according to the available data) and Abstracts Views on Vision4Press platform.
Data correspond to usage on the plateform after 2015. The current usage metrics is available 48-96 hours after online publication and is updated daily on week days.
Initial download of the metrics may take a while.