Fig. 2
Download original image
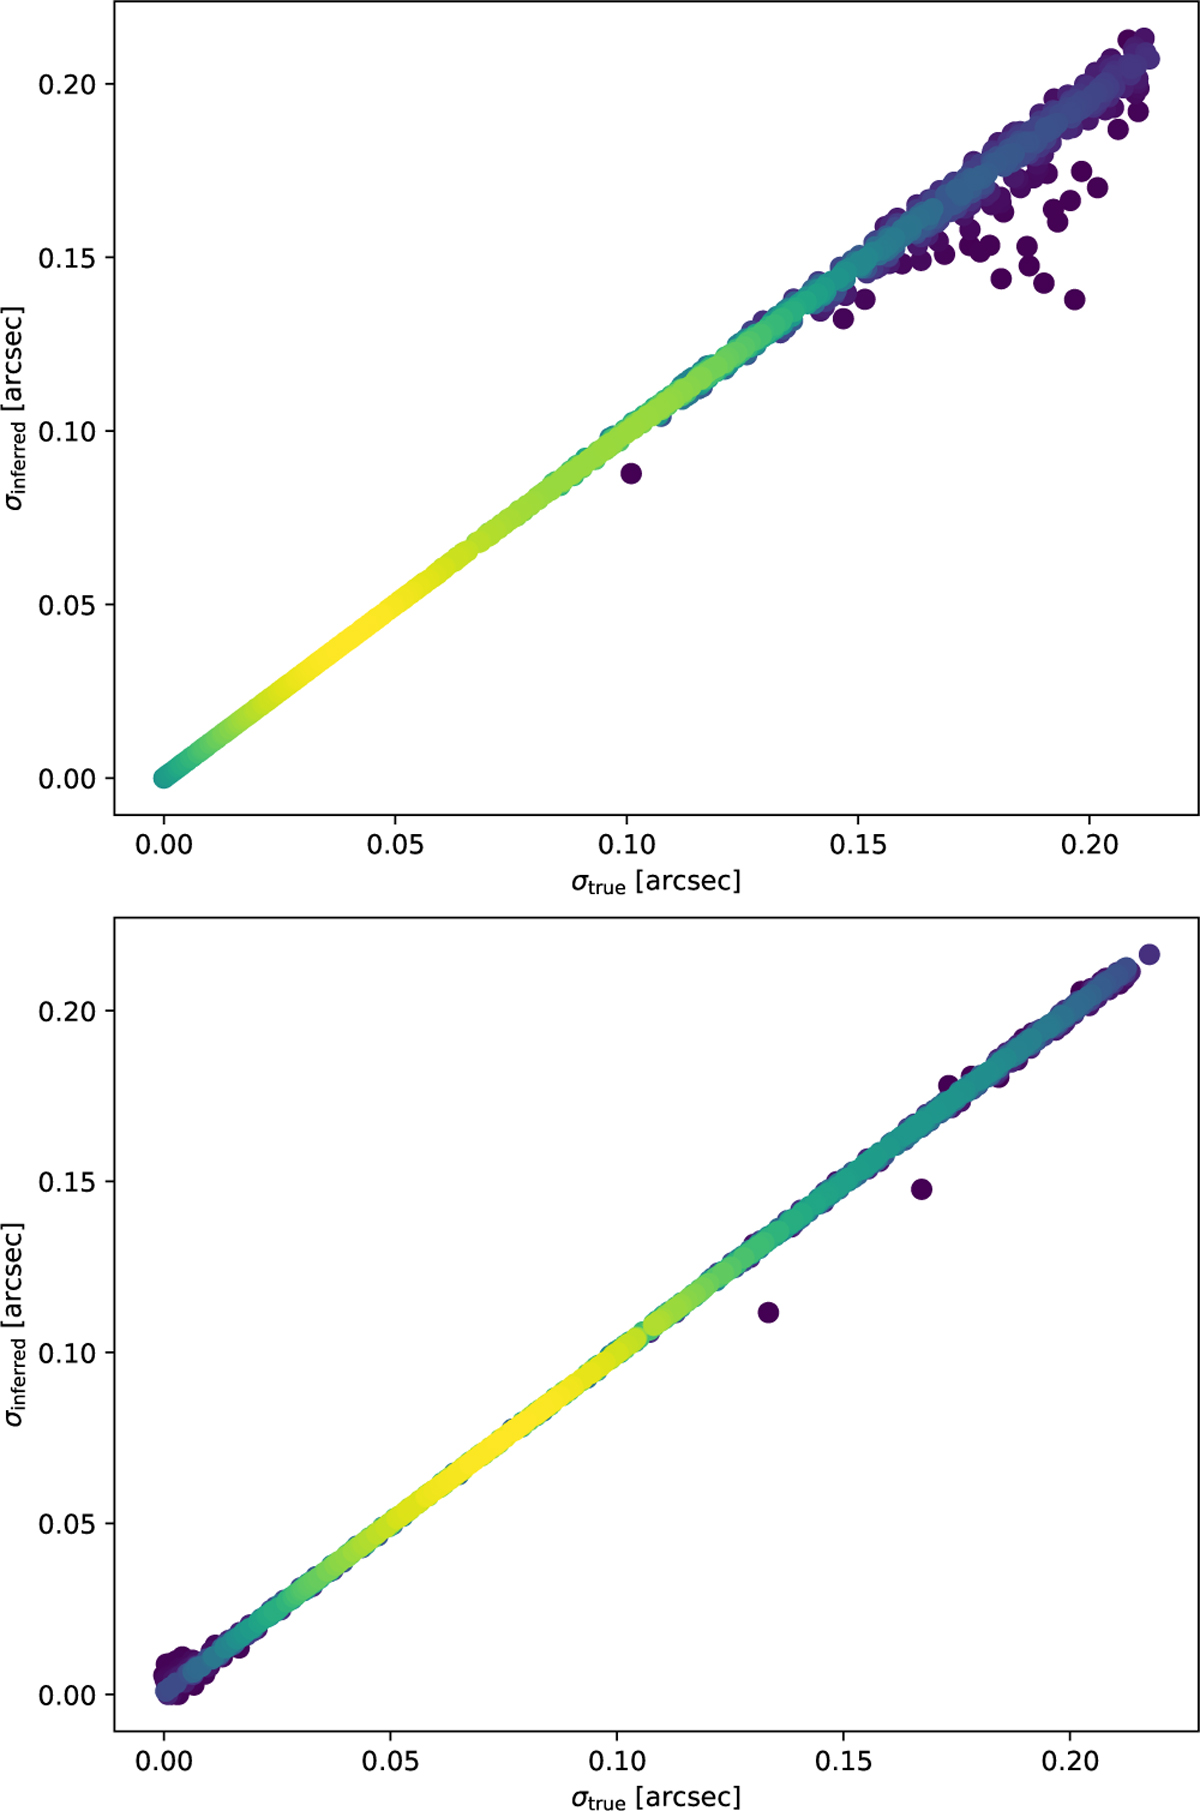
Norm of the inferred jitter amplitude against the simulated (true) one. Top: noiseless case. Bottom: numerical experiment with S/N = 100. There is an almost perfect correlation between the sensed and true jitter amplitudes up to ∼0.″10 when the simulated images are free from noise. The results begin to scatter from there on, with the algorithm tending to underpredict the induced jitter. When noise is included, the algorithm is more stable above 0.″10, but shows more dispersion below∼0.″01.
Current usage metrics show cumulative count of Article Views (full-text article views including HTML views, PDF and ePub downloads, according to the available data) and Abstracts Views on Vision4Press platform.
Data correspond to usage on the plateform after 2015. The current usage metrics is available 48-96 hours after online publication and is updated daily on week days.
Initial download of the metrics may take a while.