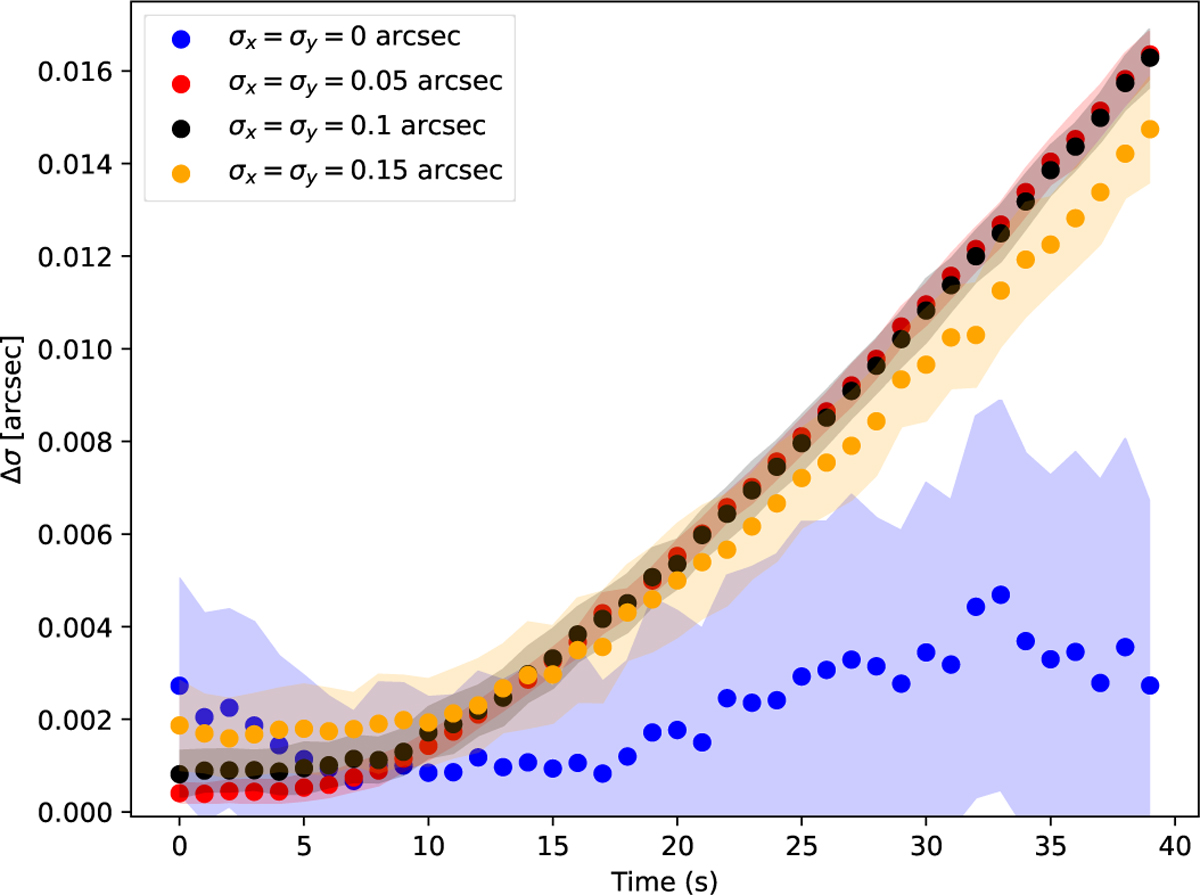
Fig. 3
Download original image
Residual jitter against the time gap between simulated images employed by the algorithm for S/N = 100 and for different levels of induced jitter. The dots represent the mean value of the residual jitter inferred for 100 realizations of the jitter. Errors, estimated as the standard deviation of the results over the 100 realizations, are shown also as a filled area. When jitter is induced in the simulations, the mean values of ∆σ display little sensitivity for time gaps up to ∼10 s, but increase nonlinearly with the time interval above that threshold almost regardless of the jitter amplitude. When the data is free of jitter, the algorithm senses an artificial fluctuating jitter with an amplitude below ∼0.″005 no matter the cadence time employed in the simulation.
Current usage metrics show cumulative count of Article Views (full-text article views including HTML views, PDF and ePub downloads, according to the available data) and Abstracts Views on Vision4Press platform.
Data correspond to usage on the plateform after 2015. The current usage metrics is available 48-96 hours after online publication and is updated daily on week days.
Initial download of the metrics may take a while.