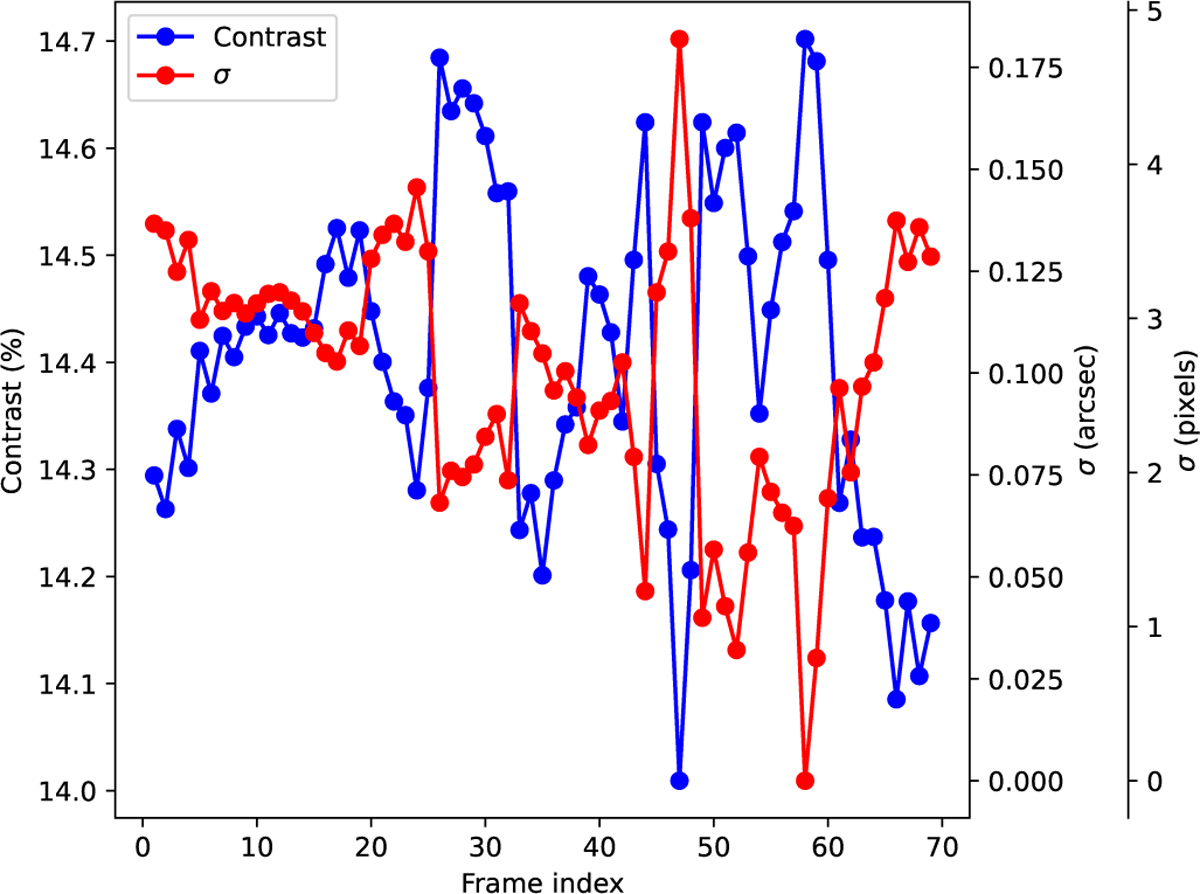
Fig. 4
Download original image
Contrast values of the image (blue dots) and the norm of the inferred jitter (red dots) – both in arcsec and pixel units – along the selected TuMag series. In some cases, fluctuations as large as ∼0.6 percentage points arise from one image to the next. The algorithm systematically compensates for lower contrast values by inferring a larger jitter amplitude.
Current usage metrics show cumulative count of Article Views (full-text article views including HTML views, PDF and ePub downloads, according to the available data) and Abstracts Views on Vision4Press platform.
Data correspond to usage on the plateform after 2015. The current usage metrics is available 48-96 hours after online publication and is updated daily on week days.
Initial download of the metrics may take a while.