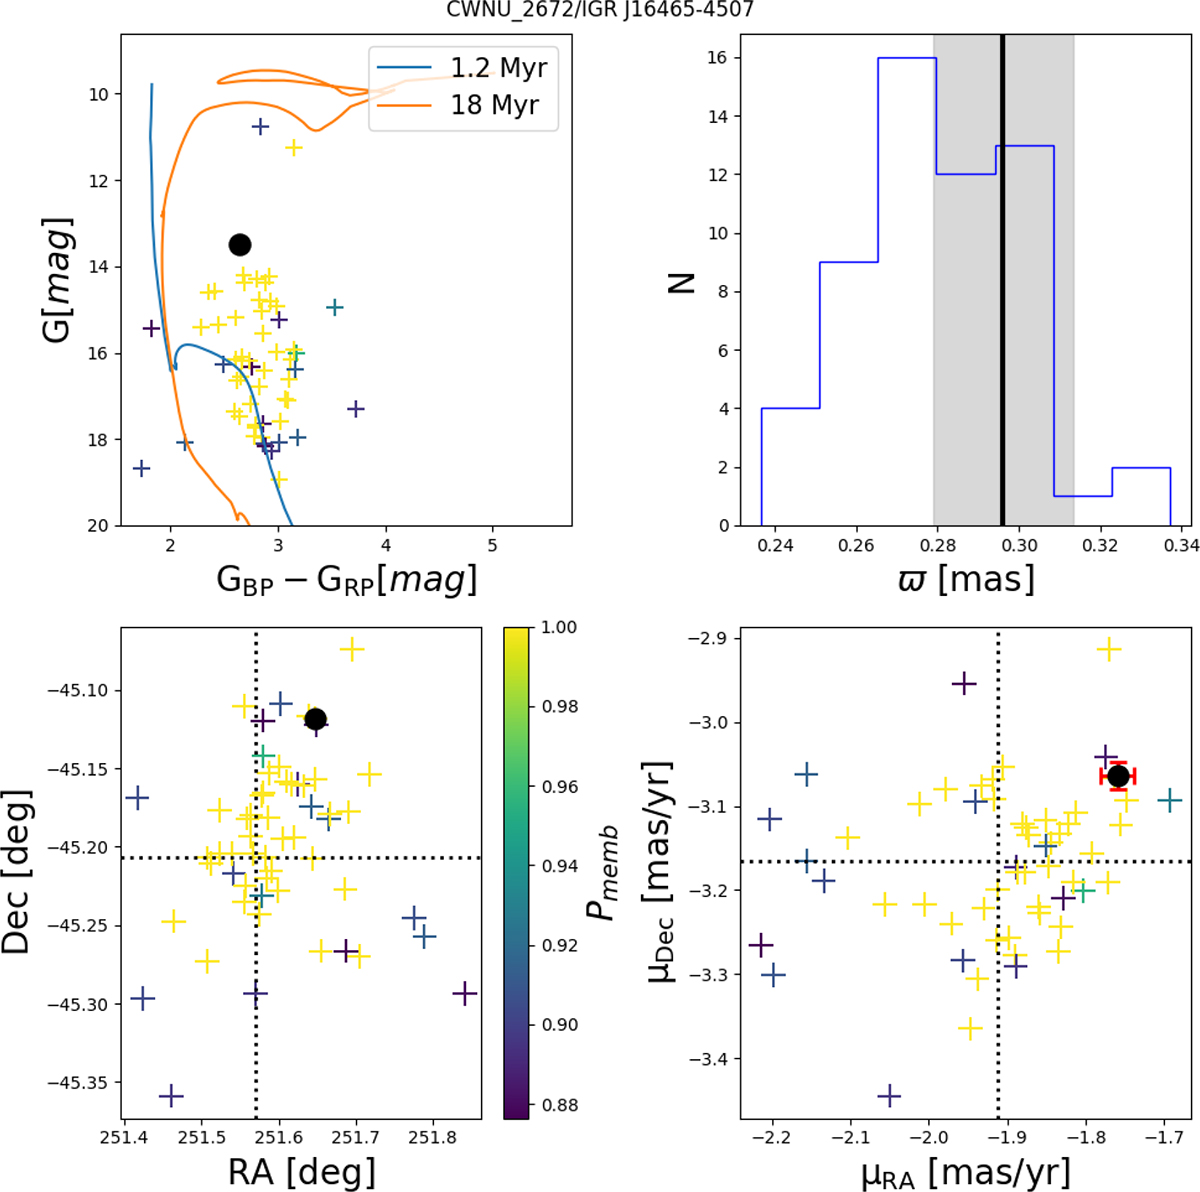
Fig. 1.
Download original image
Top left: Color-magnitude diagram of OC CWNU 2672 members from Hunt & Reffert (2023) with the HMXB IGR J16465-4507 marked by a black dot. Here and in the subsequent plots, the color encodes the probability of OC membership. A MIST isochrone or a set of MIST isochrones (Dotter 2016; Choi et al. 2016) corresponding to the OC age (as discussed in the text) are plotted. These are shifted in the visual magnitude space using the distances from Hunt & Reffert (2023) and extinctions in Cavallo et al. (2024). Solar metallicity is assumed. Top right: Parallax distribution of OC members with the parallax of the HMXB marked by a vertical black line. Bottom left: Position diagram of the OC members and HMXB in the equatorial coordinate system. The median RA and Dec of the OC members are marked by dotted black lines. Bottom right: Vector-point diagram (VPD) of the OC members and HMXB. The median μRA and μDec are marked by dotted black lines.
Current usage metrics show cumulative count of Article Views (full-text article views including HTML views, PDF and ePub downloads, according to the available data) and Abstracts Views on Vision4Press platform.
Data correspond to usage on the plateform after 2015. The current usage metrics is available 48-96 hours after online publication and is updated daily on week days.
Initial download of the metrics may take a while.