| Issue |
A&A
Volume 708, April 2026
|
|
|---|---|---|
| Article Number | A86 | |
| Number of page(s) | 8 | |
| Section | Atomic, molecular, and nuclear data | |
| DOI | https://doi.org/10.1051/0004-6361/202558418 | |
| Published online | 30 March 2026 | |
Direct determination of the astrophysical reaction rate of 141Pr(γ, n)140Pr at the SSRF-SLEGS
1
Sino-French Institute of Nuclear Engineering and Technology, Sun Yat-sen University,
Zhuhai
519082,
China
2
Institute of Modern Physics, Chinese Academy of Sciences,
Lanzhou
730000,
China
3
Key Laboratory of Nuclear Physics and Ion-beam Application (MOE), Institute of Modern Physics, Department of Nuclear Science and Technology, Fudan University,
Shanghai
200433,
China
4
Shanghai Research Center for Theoretical Nuclear Physics, NSFC and Fudan University,
Shanghai
200438,
China
5
Shanghai Advanced Research Institute, Chinese Academy of Sciences,
Shanghai
201210,
China
6
School of Nuclear Science and Technology, University of South China,
Hengyang
421001,
China
7
School of Physics, East China Normal University,
Shanghai
200241,
China
★ Corresponding authors: This email address is being protected from spambots. You need JavaScript enabled to view it.
; This email address is being protected from spambots. You need JavaScript enabled to view it.
; This email address is being protected from spambots. You need JavaScript enabled to view it.
Received:
5
December
2025
Accepted:
27
February
2026
Abstract
Context. The 141Pr(γ, n) cross-section is critical to the nucleosynthesis of p-nuclides 136,138Ce in thermonuclear supernovae and in massive stars. The photonuclear reaction of 141Pr(γ, n) provides a new method for producing 140Pr radioisotopes for positron emission tomography tracing in nuclear medicine.
Aims. We aim to perform an accurate measurement of the 141Pr(γ, n)140Pr cross-section over a sufficiently wide range of gamma energies of the p-process and deduce the 140Pr(n, γ)141Pr cross-section with γSF and TALYS-SMLO models. We determined the astrophysical reaction rate of 141Pr(γ, n)140Pr at the temperature range of 0.2–10 GK based on the new measurement cross-section of the 141Pr(γ, n)140Pr reaction.
Methods. We performed a new measurement of the 141Pr photoneutron cross-section at the Shanghai Laser Electron Gamma Source of the Shanghai Synchrotron Radiation Facility using quasi-monoenergetic laser Compton scattered γ-ray beams. The neutrons emitted by the 141Pr target were detected by the flat-efficiency detector array, while the γ beam transmitted by the 141Pr target were attenuated by a copper absorber and then measured by a bismuth germanate detector in order to reconstruct the γ spectrum incident on the target.
Results. The cross-section data of 141Pr(γ, n) were acquired using an unfolding iteration method with an uncertainty of less than 4%, and the inconsistencies between the available experimental data and evaluation libraries were discussed. The inverse reaction cross-section of 140Pr(n, γ) and the reaction rates for the 141Pr(γ, n) reaction were derived over the astrophysically relevant temperature range of the p-process nucleosynthesis model. The photodisintegration decay constants of the 141Pr(γ, n) reaction for stellar temperatures between 0.2 GK and 10 GK are provided in a tabular form and by an analytical fitting expression. The λγn(141Pr) = 0.013 ± 0.001 s−1 at a typical p-process temperature of T = 2.5 GK was also computed.
Conclusions. The photodisintegration decay constants of the 141Pr(γ, n) reaction deviate significantly from previous theoretical predictions, and the uncertainties are significantly reduced in the direct measurement.
Key words: nuclear reactions / nucleosynthesis / abundances / stars: abundances
© The Authors 2026
 Open Access article, published by EDP Sciences, under the terms of the Creative Commons Attribution License (https://creativecommons.org/licenses/by/4.0), which permits unrestricted use, distribution, and reproduction in any medium, provided the original work is properly cited.
This article is published in open access under the Subscribe to Open model. This email address is being protected from spambots. You need JavaScript enabled to view it. to support open access publication.
1 Introduction
The nucleosynthesis of heavy elements in stars is primarily driven by two neutron-capture processes: the slow (s) and the rapid (r) processes (Burbidge et al. 1957; Meyer 1994). However, the s and r processes cannot synthesise neutron-deficient stable nuclides in the mass range of A ≥ 74 (from 74Se to 196Hg; Rauscher et al. 2016; Nishimura et al. 2018). These species are known as p-nuclides, where the p signifies their relatively high proton number compared to nearby normal and neutron-rich isotopes. The stellar process that produces p-nuclides is called the p-process. This process might include the (γ, n) reaction or the (p, γ) reaction (Arnould & Goriely 2003). The p-process requires an environment with an extreme temperature (2–3 GK), a condition typically found in thermonuclear supernovae (Burbidge et al. 1957).
Regarding p-nuclides, it has been proposed that they form via photodisintegration reactions involving pre-existing seed nuclei located in the outer shells of exploding massive stars (Rauscher et al. 2016). One possible mechanism for massive stars to acquire heavy s-process seed nuclei is via mass transfer in binary systems (Jorissen et al. 2016; Bisterzo et al. 2014). The observed barium stars and carbon-enhanced metal-poor stars with s-process enrichment (Pignatari et al. 2013) provide direct evidence of this process. Thermonuclear supernovae are another candidate site for p-nuclide production, and they arise from the explosion of a white dwarf that accretes mass from a companion star (Nishimura et al. 2018). This makes them ideal sites for p-process nucleosynthesis, particularly for bottleneck nuclides such as 141Pr (Travaglio et al. 2014). These specific nuclides are produced during the explosive phase in layers enriched with seed nuclei formed via prior strong s-process nucleosynthesis (Yang et al. 2023). Fission also contributes to the production of p-nuclides. Roederer et al. (2023) indicated the existence of the fission fragments of transuranic (Z > 92) nuclei. Notably, the p-nuclides 96,98Ru, 102Pd, 156,158Dy, 162Er, 168Yb, 174Hf, 180Ta, 184Os, and 190Pt may be produced by the fission of transuranic elements synthesised in the r-process.
The origin of Solar System p-nuclides (inferred from meteoritic and geological data) is elusive due to the lack of direct observational evidence. The low elemental abundance of p-nuclides prevents detection in stars or supernova remnants, and no element has a p-isotope as its dominant form. Thus, their nucleosynthesis must be investigated solely through theoretical models (Rauscher et al. 2016; Nishimura et al. 2018). Though uncertainties are introduced at each simulation step of a theoretical model, the initial uncertainties stem from the astrophysical reaction rates employed in the nuclear reaction networks (Yang et al. 2024). The 141Pr(γ, n) cross-section is critical to the study of the p-process, particularly regarding the nucleosynthesis of p-nuclides 136,138Ce, as shown in Fig. 1.
The unique electronic configurations of 140Pr, with a 51% positron branch and a half-life of 3.39 min, make it essential in medical nuclear imaging and therapy. These characteristics also enable 140Pr to play a key role in positron emission tomography tracing of pharmaceuticals (Severin et al. 2017). Its decay daughter is a stable nuclide, 140Ce. Significantly, 140Pr can be produced by bremsstrahlung photons in an electron linear accelerator. Thus, the cross-section of the 141Pr(γ, n) reaction is a prerequisite for evaluating the economical efficiency of a 140Pr generation method.
Previous experimental studies of the 141Pr(γ, n) cross-section show discrepancies in the peak position and peak height of the giant dipole resonance (GDR; Zilges et al. 2022; Arnould & Goriely 2003). Cook et al. (1966) measured the 141Pr(γ, n) cross-section based on bremsstrahlung photons from the Iowa State University synchrotron. This measurement resolved eleven resonances in the region below 20 MeV, with yield data taken at 0.125 MeV increments. By comparing the results of two different resolutions, we found that a better resolution would extend the peak height.
Sund et al. (1970) utilised a photon beam generated by the in-flight annihilation of positrons to perform their measurement. Sund’s results are in good agreement with Cook’s results in the energy regions below 14 MeV and above 16.26 MeV. Both measurements employed a NaI crystal detector. In the region between 14 MeV and 16.26 MeV, however, Sund’s values are significantly lower, but Sund’s results show good correspondence with the results of Bramblett et al. (1966). Both results show a smooth variation of the 141Pr cross-section instead of dense resonances.
Beljaev & Semenov (1991) carried out a measurement based on betatron bremsstrahlung and a BF3 detector. Utsunomiya et al. (2006) employed laser Compton scattering γ beams and 3He proportional counters to measure the cross-section data. The systematic uncertainty was estimated to be between 5.8% and 7.2%. Their result, however, only covers the γ energy region of 9.5–12.4 MeV. Bholane et al. (2023) performed measurements using 10 and 15 MeV end point energy bremsstrahlung photons. Their results are underestimated compared with existing measurements and theoretical evaluations.
The Shanghai Laser Electron Gamma Source (SLEGS) is a γ-ray facility based on the inverse Compton scattering of 10.64 μm CO2 laser photons from 3.5 GeV relativistic electrons from the storage ring of the Shanghai Synchrotron Radiation Facility (SSRF; Wang et al. 2022). As an energy-tunable laser Compton scattering γ-ray source, SLEGS provides γ beams with energies from 0.66 to 21 MeV in the slant-scattering mode at scattering angles of 20◦ to 160◦ and with a maximum energy of 21.7 MeV in the back scattering mode at 180◦ (Liu et al. 2024b). The energy of the beamline can be adjusted in slant-scattering mode with a minimum step of 10 keV.
In this study, the 141Pr(γ, n) cross-sections were experimentally investigated by employing quasi-monochromatic and energy-tunable SLEGS γ-ray beams. In Sect. 2, a brief description of the experimental procedure utilised for the measurement of the 141Pr(γ, n) cross-section is given. In Sect. 3 the results of the cross-section and the reaction rates in our experiment are presented, and the inconsistencies between the available experimental data and evaluated data are discussed. In Sect. 4 a general conclusion of this study is presented.
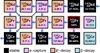 |
Fig. 1 Path of the p-process for core-collapse supernovae near 141Pr. |
2 Experimental procedure
The experimental measurement was performed at the SSRF-SLEGS by applying the γ beams within the GDR energy range from the single-neutron separation energy (Sn = 9.40 MeV) to the double-neutron separation energy (S2n = 17.33 MeV) of 141Pr. The experimental setup for the photoneutron cross-section measurement is illustrated in Fig. 2. After passing through a coarse collimator (C5, 5 mm) and a three-hole collimator (T2, 2 mm), the γ beam irradiated a 141Pr target (10 mm diameter, 5 mm thickness, 6.773 g/cm3 density, and 99.95% purity) placed at the centre of a 3He flat-efficiency detector (FED) array. The neutrons emitted by the 141Pr target were detected by the FED array, while the γ beam transmitting the 141Pr target were attenuated by a copper absorber and then measured by a bismuth germanate (BGO) detector in order to monitor the γ flux.
2.1 Detection of photoneutron with FED array
A calibrated array of 26 3He proportional counters embedded in a polyethylene moderator of 450 mm × 450 mm × 550 mm (Hao et al. 2020) was applied to detect the neutrons emitted by the photoneutron reaction (γ, n). These counters of the FED array were positioned in three concentric rings with radii of 6.5 cm, 11.0 cm, and 17.5 cm from the γ beam axis and were equipped with 1-inch diameter tubes in the inner ring and 2-inch diameter tubes in the middle and outer rings (Jiao et al. 2025). All the tubes were 0.5 cm long and filled with 3He at 2 atm. The environmental background was shielded by a layer of 2 mm thick cadmium wrapped around the polyethylene. The bremsstrahlung background was subtracted by utilising a 50 μs laser duty cycle within a 1000 μs period. The neutron number (Nn) was obtained using the time-normalised background subtraction method (Hao et al. 2025b, 2026). The average neutron energy was acquired via the ring-ratio technique proposed by Berman et al. (1967); Berman & Fultz (1975), calibrated by a 252Cf experiment and GEANT4-based efficiency curves (Hao et al. 2025a). The efficiency of the FED array is 42.10 ± 1.25%, corresponding to an average neutron energy of 2.13 MeV of 252Cf. The detector’s efficiency was high and nearly flat across the 1 keV–4 MeV neutron energy range typical for (γ, n) reactions, making it well suited for neutron detection.
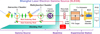 |
Fig. 2 Experimental setup for the (γ, n) cross-section measurement at SLEGS. |
2.2 Determination of the γ-ray spectrum with a BGO
A BGO detector of Φ76 mm × 200 mm was used to measure the γ-ray spectrum after copper attenuation. Its total-energy responses to monoenergetic γ-rays were characterised at the China Institute of Atomic Energy via (p, γ) reactions on LiF, 27Al, and 13C targets (Liu et al. 2024a). The γ-ray spectra measured at slant scattering angles (θL) of 95◦, 103◦, and 121◦ in this study are shown in Fig. 3a. To determine the γ-ray spectrum incident on the target, a direct unfolding technique was employed. This analysis was based on the BGO detector’s response function, obtained via GEANT4 simulations (Liu et al. 2024a).
2.3 Data analysis
The experimental cross-section (folded cross-section) was determined by Eq. (1) (Jury et al. 1979; Filipescu et al. 2014):
 (1)
(1)
where P(Eγ) denotes the normalised distribution of the incident γ ray, Nn is the detected neutron number, Nγ is the number of incident γ photons, ϵn is the average neutron detection efficiency, Nt is the areal number density of target nuclei, ξ is the correction factor for a thick target, and g is the ratio of the gamma flux above Sn.
The experimental cross-section, σexp, is usually a convolution of the energy of the incident γ-beam, and it is caused by the broadening of the γ-ray energy distribution (Guttormsen et al. 1996). To de-convolute the unfolded cross-section, σ, from the measured experimental cross-section, an unfolding method was utilised based on Eq. (2) (Utsunomiya et al. 2018, 2024):
 (2)
(2)
where σf is the experimental cross-section folded with energy distribution D, and σ is the unfolded cross-section to be determined. Equation (2) can be expressed in a matrix form:
![Mathematical equation: ${\left[ {\matrix{{{\sigma _1}} \cr {{\sigma _2}} \cr \vdots \cr {{\sigma _N}} \cr } } \right]_{\rm{f}}} = \left[ {\matrix{{{D_{11}}} & {{D_{12}}} & \cdots & \cdots & {{D_{1M}}} \cr {{D_{21}}} & {{D_{22}}} & \cdots & \cdots & {{D_{2M}}} \cr \vdots & \vdots & \vdots & \vdots & \vdots \cr {{D_{N1}}} & {{D_{N2}}} & \cdots & \cdots & {{D_{NM}}} \cr } } \right]\left[ {\matrix{{{\sigma _1}} \cr {{\sigma _2}} \cr \vdots \cr {{\sigma _M}} \cr } } \right].$](/articles/aa/full_html/2026/04/aa58418-25/aa58418-25-eq3.png) (3)
(3)
Here, N = 22 and M = 344 represent the number of folded cross-sections and the energy bins of the γ spectrum, respectively. Each row of matrix D corresponds to a target incident spectrum, with only three of these spectral curves displayed in Fig. 3b as examples.
An initial vector of cross-section σ0 was selected to start the iteration. It was then multiplied by D to obtain the zeroth folded vector:  .
.
We set up the next trial input function σ1 by adding the difference between σexp and  to σ0:
 (4)
(4)
We iterated the above steps i times:
 (5)
(5)
 (6)
(6)
Once the convergence condition below was satisfied, the iteration came to an end:
 (7)
(7)
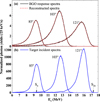 |
Fig. 3 (a) Typical spectra measured by the BGO detector (black line) and reconstructed from incident γ-ray spectra (dashed red line). (b) Corresponding γ spectra incident on the 141Pr target. |
3 Results and discussions
3.1 141Pr(γ, n)140Pr reaction cross-section
The folded cross-section and the monochromatic (unfolded) cross-section of the 141Pr(γ, n)140Pr reaction obtained in this study, as well as their uncertainty, are illustrated in Fig. 4a and listed in Table A.11. The present result has a systematic uncertainty of 3.17%, coming from the FED efficiency uncertainty of 3.02%, the BGO γ-spectrum uncertainty of 0.90%, and the target thickness uncertainty of 0.10%. The methodological uncertainty of this result is estimated to be about 2.05%, originating from the uncertainty of the neutron count algorithm of 2% and the uncertainty of the γ-spectrum unfolding method of 1%. Finally, the total uncertainty of this result is approximately 4%, except for the (Eγ, σ(Eγ)) pair of (9.57 MeV, 10.59 mb).
The present result is compared with previous studies in Figs. 4b and 5. Our result agrees well with previous values within the energy range of 9.5–13 MeV. In the region of 13–17 MeV, our result shows systematic deviation from other experimental values and the TALYS-based Evaluated Nuclear Data Library, 2023 version (TENDL-2023, Koning et al. 2019). The ratios of this result to the previous data are also shown in Fig. 5. In general, most of the ratios are distributed in the region of 0.5–1.5. This difference provides a new perspective for further theoretical calculation and experimental investigation.
According to the theoretical calculation of Belyaev et al. (1995), the peak value of the 141Pr(γ, n) cross-section is about 450 mb. Moreover, the experimental result obtained by Cannington et al. (1968) indicates that the maximum cross-section at the main GDR peak at 15.45 MeV can be more than 500 mb. These findings support the reliability of our result to some extent.
The total cross-section integrated over the energy region of interest is defined as follows:
 (8)
(8)
The systematic differences between two cross-section curves can be shown by their integral ratio  (Varlamov et al. 2017). The integral ratios of this result in relation to the previous values,
  , are presented in Table 1. At the energy range of S n-13 MeV, the integral ratios are between 0.96 and 1.16, showing good consistency. At the energy range of 13 MeV-S 2n, the integral ratios are distributed between 1.05 and 1.29, evidencing a slight deviation.
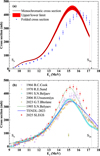 |
Fig. 4 (a) Reaction cross-section of 141Pr(γ, n) as a function of the incident γ energy. The dots denote the folded cross-section, and the line with a shaded area is the monochromatic (unfolded) cross-section. (b) Comparison between this result of the cross-section and that of previous studies. |
Integral ratios of this result in relation to the previous values.
3.2 Radiative 140Pr(n, γ) cross-section
The γ-ray strength function (γSF; Bartholomew et al. 1973; Kristiak & Betàk 2012) is a statistical quantity that describes compound nuclear reactions within the Hauser–Feshbach model. Its role in the de-excitation process enables the calculation of radiative (n, γ) cross-sections, which are crucial for the s-process nucleosynthesis of elements heavier than iron. According to the principle of detailed balance (Blatt & Weisskopf 1952) and the generalised Brink hypothesis, the equality of the upward and downward  gives the expression of the (downward) γSF with the (upward) (γ, n) cross-section σγn through Eq. (9) (Capote et al. 2009):
 (9)
(9)
Here, X is either electric (E) or magnetic (M). The spin factor gJ = (2J + 1)/(2J0 + 1) (Zilges et al. 2022), where J = 1 and J0 = 0 (ground state), and 1/gJπ2ℏ2c2 = 8.674 × 10⁻⁸ mb−1MeV−2. This relation yields the experimentally constrained γSF from the measured 141Pr(γ, n) reaction data, as indicated by the red dots in Fig. 6a.
The TALYS code (v1.96; Koning & Rochman 2012; Koning et al. 2023) incorporates various phenomenological and microscopic models to describe the γSF. The default and adjusted simple modified Lorentzian (SMLO) models (Goriely & Plujko 2019) for the E1 strength closely approximate the experimental values. The dotted red and blue lines in Fig. 6a represent the γSFs calculated using the SMLO models. The dashed green line in Fig. 6a illustrates the spin-flip and scissor model of the M1 strength (Balbutsev et al. 2011).
The radiative (n, γ) cross-section is dependent on the γSF and highly sensitive to the choice of the nuclear level density model (Li et al. 2023). The radiative 140Pr(n, γ) cross-section was calculated based on the adjusted SMLO model (Li et al. 2025). The results are presented in Fig. 6b with the red band. The spin-flip and scissor model of the M1 strength was considered in the TALYS calculations. The theoretical uncertainty corresponds to the employment of six nuclear level density models (Koning et al. 2023). In Fig. 6b, our results are compared with JENDL/AD-2017 and TENDL-2023 evaluations. We observed good agreement between our results and each of the evaluation curves. To the best of our knowledge, this work provides the first experimentally constrained cross-section for the 140Pr(n, γ) reaction. This result thereby provides direct support for the principle of detailed balance and the generalised Brink hypothesis in the case of the 141Pr isotope.
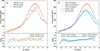 |
Fig. 5 Comparison of the present 141Pr(γ, n) cross-section from SLEGS (dotted solid red line) with (a) the 141Pr(γ, n) cross-section from Cook et al. (1966, purple rhombus) and Sund et al. (1970, yellow triangle), (b) the 141Pr(γ, n) cross-section from Beljaev & Semenov (1991, cyan triangle), Utsunomiya et al. (2006, brown circle), Belyaev et al. (1995, dashed green line), and the 141Pr(γ, n) cross-section from TENDL-2023 Koning et al. (2019, solid blue line). |
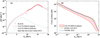 |
Fig. 6 (a) Comparison of the γSF of 141Pr calculated using the default (dashed blue line) and adjusted (red line) SMLO models for the E1 strength in TALYS with the γSF extracted from our data (red dots). The spin-flip and scissor model for the M1 strength is indicated by the dashed green line. (b) Cross-section of 140Pr(n, γ) calculated with the TALYS code based on the adjusted SMLO model. |
3.3 Photodisintegration decay constant
The reaction rate of a photo-induced reaction (number of reactions per time and per unit volume) can also be called a photodisintegration rate. If we divide the photodisintegration rate by the target nucleus density (particles per volume), we obtain a decay constant (probability of decay per nucleus per second). The decay constant of a (γ, n) reaction can be determined with Eq. (10):
 (10)
(10)
with rγn as the photodisintegration rate, N as the target nucleus density, c as the speed of light, and Cγ(Eγ) as the number of photons with energy Eγ. The calculation shows that the cross-section above S 2n contributes negligibly to the integral, as the photon number decreases rapidly. This validates our choice of integration region. In this study, we find λγn(141Pr) = 0.013 ± 0.001 s−1 at a typical p-process temperature of T = 2.5 GK, which agrees with the value (0.015 ± 0.004 s−1) of Utsunomiya et al. (2006) within the respective uncertainties, as shown in Fig. 7a. The uncertainty in our result is an improvement over that of Utsunomiya et al. (2006). In Table B.1 we compare the photodisintegration decay constants for stellar temperatures between 0.2 GK and 10 GK obtained in this work with values from previous studies2.
The λγn ratios of the previous values in relation to the SLEGS results,  , at the temperature range of 0.2–10 GK are illustrated in Fig. 7b. Overall, the λγn(141Pr) obtained in this work are lower than those reported by Belyaev et al. (1995) at the entire range and Utsunomiya et al. (2006) above 0.9 MeV. However, they are higher than those from TENDL-2023 (Koning et al. 2019), and compared to those from Rauscher & Thielemann (2000), they are lower below 4.5 MeV and higher above 4.5 MeV. This work obtained an experimental 141Pr(γ, n)140Pr reaction cross-section at the energy range of Sn to S2n. The broad energy coverage provides high-precision input, ensuring a more accurate calculation of the λγn(141Pr). The present λγn deviate significantly from previous theoretical predictions, and the uncertainties are significantly reduced.
A common form of the reaction rate is an analytical formula with an appropriate parametrization for applications in the p-process of stellar models. We used the standard form of the JINA Reaclib Database (Cyburt et al. 2010) to fit λγn(141Pr) as a function of T9 (GK) and obtained a = [a0, a1, a2, a3, a4, a5, a6] in Eq. (11):
 (11)
(11)
The fitting results we obtained show that a = [57.09, 157.9, -5263, 5253, -194.9, 7.284, -3173], with R2 = 0.9999.
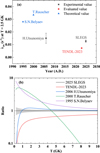 |
Fig. 7 (a) Comparison of λγn at T = 2.5 GK. (b) Ratios of λγn of the previous values in relation to the SLEGS results |

4 Conclusion
We performed new measurements on the cross-section of the 141Pr(γ, n) cross-section in the energy range Sn to S2n by applying quasi-monoenergetic γ beams at SLEGS. Based on the unfolding iteration method, the unfolded cross-section data were acquired within the energy region of 9.57–17.12 MeV, with a total uncertainty of approximately 3.9%. The present result demonstrates good consistency with previous values at the energy range of S n-13 MeV and a slight discrepancy at the energy range of 13 MeV-S 2n. We determined the radiative 140Pr(n, γ) cross-section using the adjusted SMLO model for the E1 strength in TALYS with the γSF extracted from our data. The photodisintegration decay constant at the temperature range of 0.2–10 GK was computed and compared to the results of previous studies.
This result will provide key data for the study of the p-process, particularly the nucleosynthesis of p-nuclides 136,138Ce. The implications of the newly determined 141Pr(γ, n) cross-sections for the abundances of the p-nuclei 136,138Ce can be qualitatively assessed based on the findings of Rayet et al. (1990) and Käppeler et al. (1996). A future study may be carried out to see if the present data would ameliorate the isotope pattern in the calculations of Prantzos et al. (1990), together with the 136,138Ce(n, γ) cross-section measured by Sahoo et al. (2024). Furthermore, the new result will contribute to the production of medical isotopes via accelerator, such as 140Pr. Further investigation will be conducted to extend the measurement range to above S 2n, advance the theoretical understanding of newly observed resonance states, and facilitate the direct application of the findings to stellar evolution modelling and nuclear technology systems.
Acknowledgements
We thank the BL03SSID of the SSRF (https://cstr.cn/31124.02.SSRF.BL03SSID) for the assistance on measurements and analysis. This work was supported by the National Natural Science Foundation of China (Grant Nos. 12475152, 12147101, U1832182, and U2032137), and the Natural Science Foundation of Guangdong Province, China (Grant No. 2022A1515011184).
References
- Arnould, M., & Goriely, S. 2003, Phys. Rep., 384, 1 [Google Scholar]
- Balbutsev, E., Molodtsova, I., & Schuck, P. 2011, Nucl. Phys. A, 872 [Google Scholar]
- Bartholomew, G. A., Earle, E. D., Ferguson, A. J., Knowles, J. W., & Lone, M. A. 1973, in Advances in Nuclear Physics, 7, eds. M. Baranger, & E. Vogt (Boston, MA: Springer US), 229 [Google Scholar]
- Beljaev, S. N., & Semenov, V. A. 1991, Izv. Akad. Nauk SSSR, 155, 55 [Google Scholar]
- Belyaev, S. N., Vasil’ev, O. V., Nechkin, A. A., et al. 1995, The structure of the (γ, n) cross section in 141Pr, Tech. rep. Berman, B. L., & Fultz, S. C. 1975, Rev. Mod. Phys., 47, 713 [Google Scholar]
- Berman, B. L., Caldwell, J. T., Harvey, R. R., et al. 1967, Phys. Rev., 162, 1098 [CrossRef] [Google Scholar]
- Bholane, G. T., Ganesapandy, T. S., Patil, S. H., et al. 2023, Eur. Phys. J. A, 59, 127 [Google Scholar]
- Bisterzo, S., Travaglio, C., Gallino, R., Wiescher, M., & Käppeler, F. 2014, ApJ, 787, 10 [NASA ADS] [CrossRef] [Google Scholar]
- Blatt, J. M., & Weisskopf, V. F. 1952, Theoretical Nuclear Physics (New York: Wiley) [Google Scholar]
- Bramblett, R., Caldwell, J., Berman, B., Harvey, R., & Fultz, S. 1966, Phys. Rev., 148, 1198 [Google Scholar]
- Burbidge, E. M., Burbidge, G. R., Fowler, W. A., & Hoyle, F. 1957, Rev. Mod. Phys., 29, 547 [NASA ADS] [CrossRef] [Google Scholar]
- Cannington, P. H., Stewart, R. J. J., Spicer, B. M., & Huber, M. G. 1968, Nucl. Phys. A, 109, 385 [Google Scholar]
- Capote, R., Herman, M., Obložinský, P., et al. 2009, Nucl. Data Sheets, 110, 3107 [CrossRef] [Google Scholar]
- Cook, B. C., Hutchinson, D. R., Waring, R. C., et al. 1966, Phys. Rev., 143, 730 [Google Scholar]
- Cyburt, R. H., Amthor, A. M., Ferguson, R., et al. 2010, ApJS, 189, 240 [NASA ADS] [CrossRef] [Google Scholar]
- Filipescu, D. M., Gheorghe, I., Utsunomiya, H., et al. 2014, Phys. Rev. C, 90, 064616 [CrossRef] [Google Scholar]
- Goriely, S., & Plujko, V. 2019, Phys. Rev. C, 99, 014303 [NASA ADS] [CrossRef] [Google Scholar]
- Guttormsen, M., Tveter, T. S., Bergholt, L., Ingebretsen, F., & Rekstad, J. 1996, Nucl. Instrum. Methods Phys. Res., Sect. A, 374, 371 [Google Scholar]
- Hao, Z. R., Fan, G. T., Liu, L. X., et al. 2020, Nucl. Tech., 43, 110501 [Google Scholar]
- Hao, Z. R., Fan, G. T., Wang, H. W., et al. 2025a, Sci. Bull., 70, 2591 [Google Scholar]
- Hao, Z. R., Liu, L. X., Zhang, Y., et al. 2025b, Nucl. Sci. Tech., 36, 183 [Google Scholar]
- Hao, Z. R., Liu, L., Wang, H. W., et al. 2026, Nucl. Instrum. Methods Phys. Res., Sect. A, 1082, 171026 [Google Scholar]
- Jiao, P., Hao, Z. R., Sun, Q. K., et al. 2025, Nucl. Sci. Tech., 36, 66 [Google Scholar]
- Jorissen, A., Van Eck, S., Van Winckel, H., et al. 2016, A&A, 586, A158 [NASA ADS] [CrossRef] [EDP Sciences] [Google Scholar]
- Jury, J. W., Berman, B. L., Faul, D. D., et al. 1979, Phys. Rev. C, 19, 1684 [CrossRef] [Google Scholar]
- Koning, A. J., & Rochman, D. 2012, Nucl. Data Sheets, 113, 2841 [NASA ADS] [CrossRef] [Google Scholar]
- Koning, A. J., Rochman, D., Sublet, J.-C., et al. 2019, Nucl. Data Sheets, 155, 1 [CrossRef] [Google Scholar]
- Koning, A., Hilaire, S., & Goriely, S. 2023, Eur. Phys. J. A, 59, 131 [CrossRef] [Google Scholar]
- Kristiak, J., & Betàk, E. 2012, Neutron Induced Reactions: Proceedings of the 4th International Symposium Smolenice, Czechoslovakia, June 1985 (Springer Science & Business Media) [Google Scholar]
- Käppeler, F., Toukan, K. A., Schumann, M., & Mengoni, A. 1996, Phys. Rev. C, 53, 1397 [CrossRef] [PubMed] [Google Scholar]
- Li, X. K., An, Z. D., Jiang, W., et al. 2023, Phys. Rev. C, 108, 035802 [Google Scholar]
- Li, Z. C., Hao, Z. R., Sun, Q. K., et al. 2025, Nucl. Sci. Tech., 36, 34 [Google Scholar]
- Liu, L. X., Utsunomiya, H., Fan, G. T., et al. 2024a, Nucl. Instrum. Methods Phys. Res., Sect. A, 1063, 169314 [Google Scholar]
- Liu, L. X., Wang, H. W., Fan, G. T., et al. 2024b, Nucl. Sci. Tech., 35, 111 [Google Scholar]
- Meyer, B. S. 1994, ARA&A, 32, 153 [Google Scholar]
- Nishimura, N., Rauscher, T., Hirschi, R., et al. 2018, MNRAS, 474, 3133 [NASA ADS] [CrossRef] [Google Scholar]
- Pignatari, M., Zinner, E., Bertolli, M. G., et al. 2013, ApJ, 771, L7 [Google Scholar]
- Prantzos, N., Hashimoto, M., Rayet, M., & Arnould, M. 1990, A&A, 238, 455 [NASA ADS] [Google Scholar]
- Rauscher, T., & Thielemann, F.-K. 2000, ADNDT, 75, 1 [Google Scholar]
- Rauscher, T., Nishimura, N., Hirschi, R., et al. 2016, MNRAS, 463, 4153 [CrossRef] [Google Scholar]
- Rayet, M., Arnould, M., & Prantzos, N. 1990, A&A, 227, 271 [NASA ADS] [Google Scholar]
- Roederer, I. U., Vassh, N., Holmbeck, E. M., et al. 2023, Science, 382, 1177 [CrossRef] [PubMed] [Google Scholar]
- Sahoo, R. N., Paul, M., Kashiv, Y., et al. 2024, Phys. Rev. C, 109, 025808 [Google Scholar]
- Severin, G. W., Kristensen, L. K., Nielsen, C. H., et al. 2017, Front. Med., 4, 98 [Google Scholar]
- Sund, R. E., Verbinski, V. V., Weber, H., & Kull, L. A. 1970, Phys. Rev. C, 2, 1129 [Google Scholar]
- Travaglio, C., Gallino, R., Rauscher, T., et al. 2014, ApJ, 795, 141 [NASA ADS] [CrossRef] [Google Scholar]
- Utsunomiya, H., Makinaga, A., Goko, S., et al. 2006, Phys. Rev. C, 74, 025806 [Google Scholar]
- Utsunomiya, H., Renstrøm, T., Tveten, G. M., et al. 2018, Phys. Rev. C, 98, 054619 [CrossRef] [Google Scholar]
- Utsunomiya, H., Goriely, S., Kimura, M., et al. 2024, Phys. Rev. C, 109, 014617 [Google Scholar]
- Varlamov, V., Ishkhanov, B., & Orlin, V. 2017, Phys. Rev. C, 95, 054607 [Google Scholar]
- Wang, H. W., Fan, G. T., Liu, L. X., et al. 2022, Nucl. Sci. Tech., 33, 87 [Google Scholar]
- Yang, G. L., An, Z. D., Jiang, W., et al. 2023, Nucl. Sci. Tech., 34, 1 [Google Scholar]
- Yang, G. L., An, Z. D., Jiang, W., et al. 2024, Phys. Rev. Res., 6, 013225 [Google Scholar]
- Zilges, A., Balabanski, D., Isaak, J., & Pietralla, N. 2022, Prog. Part. Nucl. Phys., 122, 103903 [CrossRef] [Google Scholar]
The unfolded cross-section is also accessible via https://doi.org/10.57760/sciencedb.32822.
The photodisintegration decay constants are also accessible via https://doi.org/10.57760/sciencedb.32822.
Appendix A 141Pr(γ, n)140Pr cross-section
Table A.1 shows the unfolded 141Pr(γ, n)140Pr cross-section as well as its corresponding uncertainties.
Unfolded cross-section and corresponding uncertainties for 141Pr(γ, n)140Pr.
Appendix B Photodisintegration decay constant
Table B.1 presents the photodisintegration decay constant λγn of 141Pr calculated in this work as a function of T9, compared with values from previous studies.
Photodisintegration decay constant of 141Pr determined in this work compared with values from previous studies.
All Tables
Photodisintegration decay constant of 141Pr determined in this work compared with values from previous studies.
All Figures
|
Fig. 1 Path of the p-process for core-collapse supernovae near 141Pr. |
| In the text | |
|
Fig. 2 Experimental setup for the (γ, n) cross-section measurement at SLEGS. |
| In the text | |
|
Fig. 3 (a) Typical spectra measured by the BGO detector (black line) and reconstructed from incident γ-ray spectra (dashed red line). (b) Corresponding γ spectra incident on the 141Pr target. |
| In the text | |
|
Fig. 4 (a) Reaction cross-section of 141Pr(γ, n) as a function of the incident γ energy. The dots denote the folded cross-section, and the line with a shaded area is the monochromatic (unfolded) cross-section. (b) Comparison between this result of the cross-section and that of previous studies. |
| In the text | |
|
Fig. 5 Comparison of the present 141Pr(γ, n) cross-section from SLEGS (dotted solid red line) with (a) the 141Pr(γ, n) cross-section from Cook et al. (1966, purple rhombus) and Sund et al. (1970, yellow triangle), (b) the 141Pr(γ, n) cross-section from Beljaev & Semenov (1991, cyan triangle), Utsunomiya et al. (2006, brown circle), Belyaev et al. (1995, dashed green line), and the 141Pr(γ, n) cross-section from TENDL-2023 Koning et al. (2019, solid blue line). |
| In the text | |
|
Fig. 6 (a) Comparison of the γSF of 141Pr calculated using the default (dashed blue line) and adjusted (red line) SMLO models for the E1 strength in TALYS with the γSF extracted from our data (red dots). The spin-flip and scissor model for the M1 strength is indicated by the dashed green line. (b) Cross-section of 140Pr(n, γ) calculated with the TALYS code based on the adjusted SMLO model. |
| In the text | |
|
Fig. 7 (a) Comparison of λγn at T = 2.5 GK. (b) Ratios of λγn of the previous values in relation to the SLEGS results |
| In the text | |
Current usage metrics show cumulative count of Article Views (full-text article views including HTML views, PDF and ePub downloads, according to the available data) and Abstracts Views on Vision4Press platform.
Data correspond to usage on the plateform after 2015. The current usage metrics is available 48-96 hours after online publication and is updated daily on week days.
Initial download of the metrics may take a while.