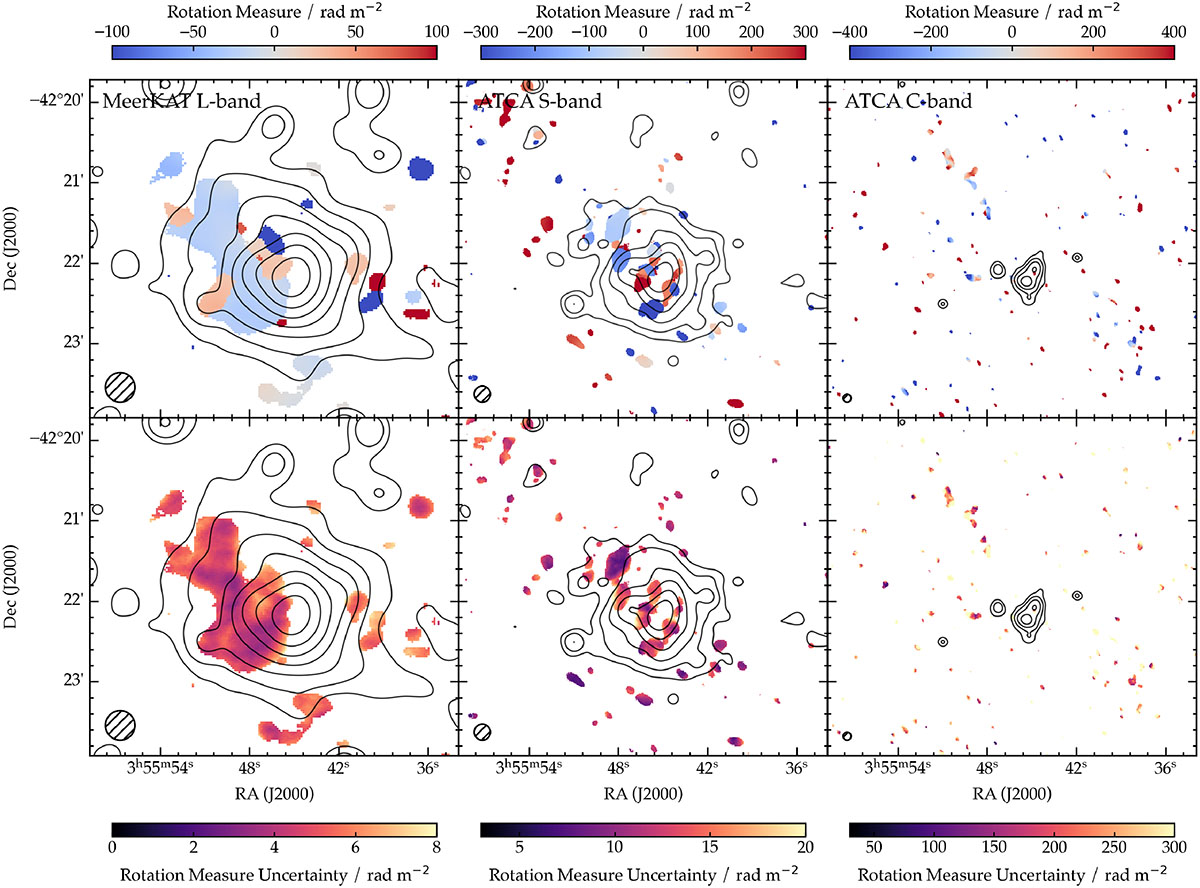
Fig. C.2.
Download original image
Foreground-corrected rotation measure (top row) and its uncertainty maps (bottom row) of the MeerKAT L-band data (left panels), ATCA L/S-band (middle panels) and ATCA C-band (right panels). Total intensity of MeerKAT 1194 MHz (left panels) ATCA 2166 MHz (middle panels) and ATCA 5430 MHz (right panels) contours are overlaid starting at 3σ and increase by a factor of 2 (σ1194 MHz = 30μJy/beam; σ2166 MHz = 15μJy/beam; σ5430 MHz = 11μJy/beam). For each panel, the circular beam appears in the lower left panel.
Current usage metrics show cumulative count of Article Views (full-text article views including HTML views, PDF and ePub downloads, according to the available data) and Abstracts Views on Vision4Press platform.
Data correspond to usage on the plateform after 2015. The current usage metrics is available 48-96 hours after online publication and is updated daily on week days.
Initial download of the metrics may take a while.