Fig. 2.
Download original image
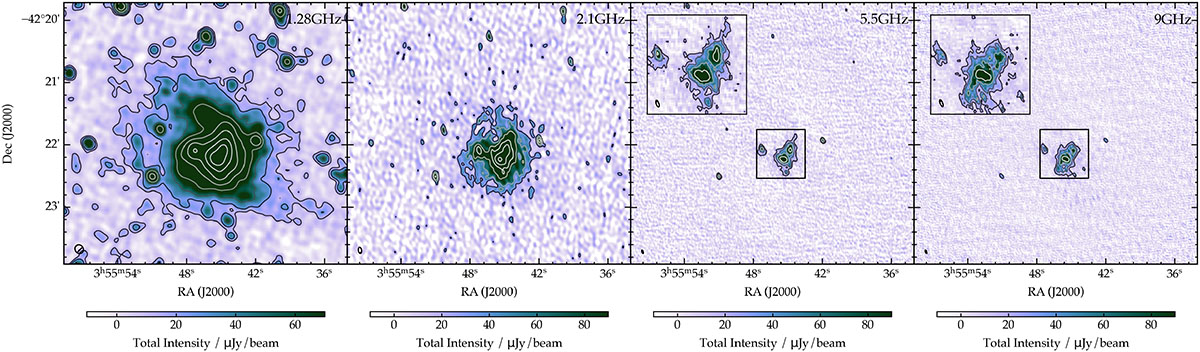
Left: Total intensity map at 1.28 GHz of NGC 1487 with a noise level σI of 4 μJy/beam observed with MeerKAT. Middle left: Total intensity map at 2.1 GHz of NGC 1487 with a noise level σI of 8 μJy/beam observed with ATCA. Middle right: Total intensity map at 5.5 GHz of NGC 1487 with a noise level σI of 5.5 μJy/beam observed with ATCA. Right: Total intensity map at 9 GHz of NGC 1487 with a noise level σI of 5.5 μJy/beam observed with ATCA. The overlaid contours of the total intensity start at 3 σ and increase by factor of 2. The resolution of the different maps can be taken from Table 3 and is shown in the bottom left corner.
Current usage metrics show cumulative count of Article Views (full-text article views including HTML views, PDF and ePub downloads, according to the available data) and Abstracts Views on Vision4Press platform.
Data correspond to usage on the plateform after 2015. The current usage metrics is available 48-96 hours after online publication and is updated daily on week days.
Initial download of the metrics may take a while.