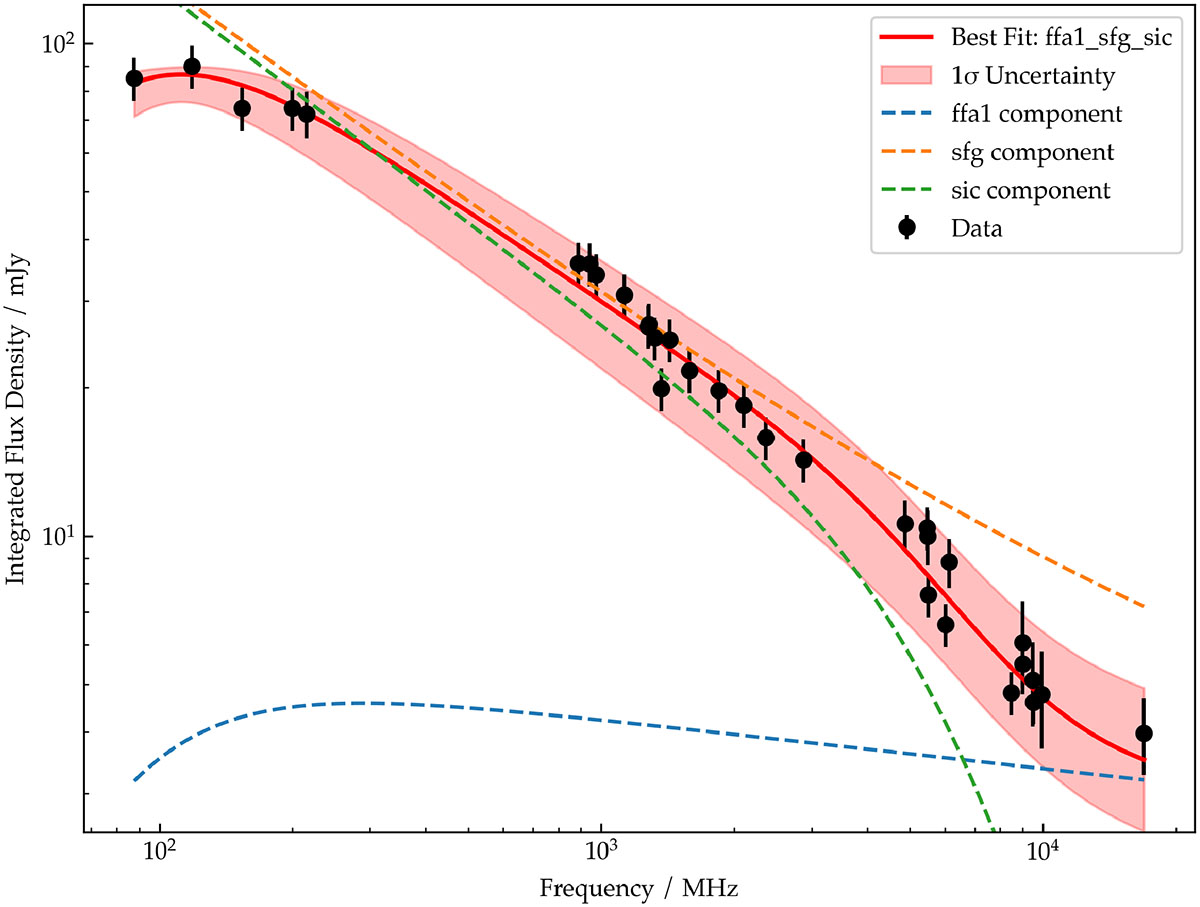
Fig. 3.
Download original image
Spectral energy distribution of NGC 1487. The plot displays total intensity data with different observations: GLEAM-X data (Ross et al. 2024), RACS-Low data (McConnell et al. 2020), ASKAP EMU main survey (Hopkins et al. 2025), MeerKAT 1.28 GHz data, ATCA L/S-band, C-band, and X-band data presented in this work, and further data from the work of Grundy et al. (2025). We show the best-fit in red with 1σ uncertainty sampled by EMCEE. The blue, orange, and green dotted lines represent the different components of the best-fit model.
Current usage metrics show cumulative count of Article Views (full-text article views including HTML views, PDF and ePub downloads, according to the available data) and Abstracts Views on Vision4Press platform.
Data correspond to usage on the plateform after 2015. The current usage metrics is available 48-96 hours after online publication and is updated daily on week days.
Initial download of the metrics may take a while.