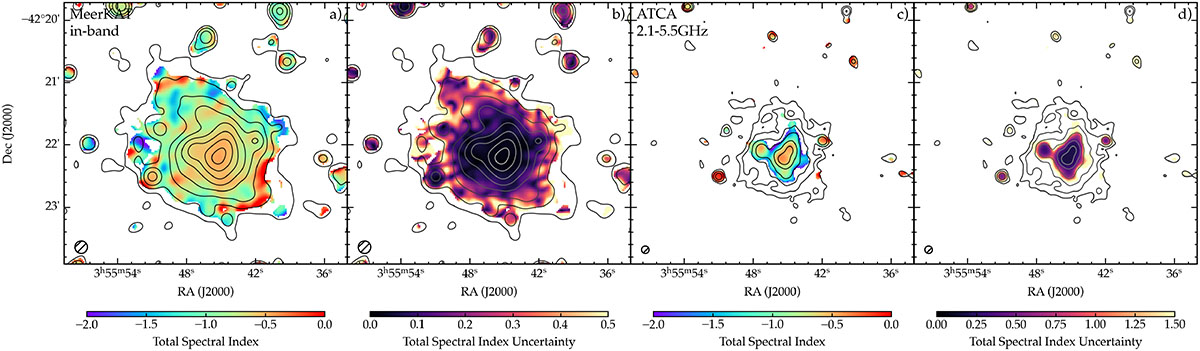
Fig. 4.
Download original image
Inband total spectral index of the MeerKAT L-band (panel a)) and its uncertainty (panel b)) between the frequencies 0.96 and 1.59 GHz overlaid with radio emission at frequency of 1.28 GHz starting at 3σ and increase by a factor of 2 (σ = 9 μJy/beam). The resolution of 12″ is shown in the bottom left corner. Two-point total spectral index (panel c)) and its uncertainty (panel d)) between ATCA L/S-band (2.1 GHz) and C-band (5.5 GHz) overlaid with radio emission at frequency of 2.1 GHz starting at 3σ and increase by a factor of 2 (σ = 11.3 μJy/beam). The resolution of 7″ is shown in the bottom left corner.
Current usage metrics show cumulative count of Article Views (full-text article views including HTML views, PDF and ePub downloads, according to the available data) and Abstracts Views on Vision4Press platform.
Data correspond to usage on the plateform after 2015. The current usage metrics is available 48-96 hours after online publication and is updated daily on week days.
Initial download of the metrics may take a while.