Fig. 2
Download original image
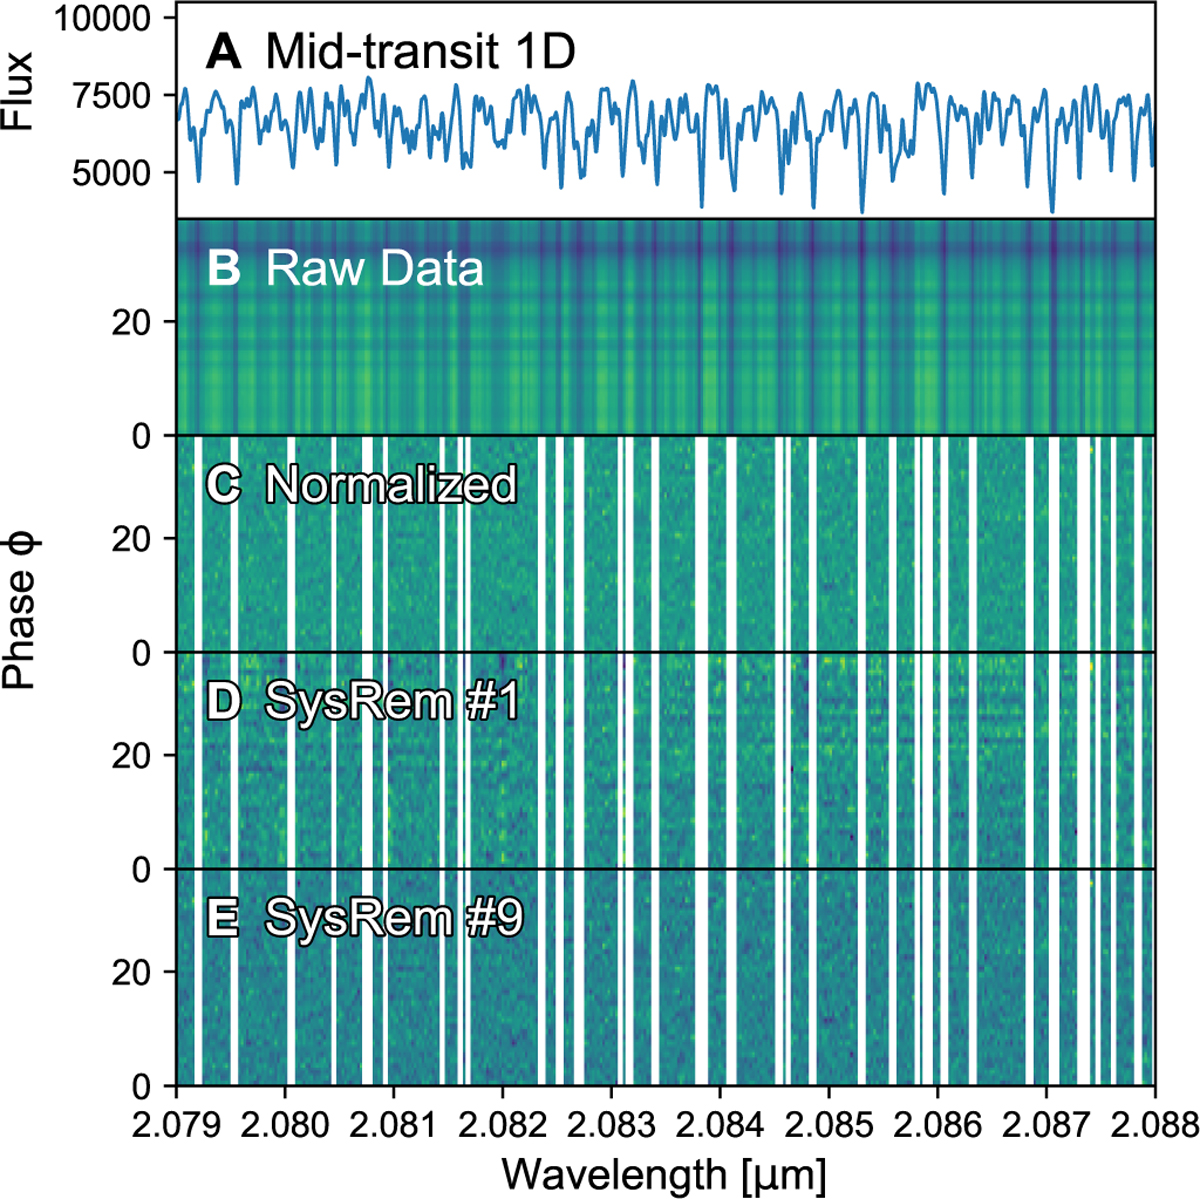
Steps of the data preparation applied to a representative spectral region of the dataset obtained on the night of 31 March 2022. The vertical axis in panel A represents flux in arbitrary units, while in all other panels it represents time, expressed as the planet’s orbital phase. Panel A: original spectrum observed at mid-transit, where telluric absorption lines from H2O can be identified. Panel B: original spectral matrix extracted using CR2RES, where major S/N differences between spectra (horizontal stripes) and prominent telluric H2O absorption (vertical stripes) can be identified. Panel C: normalised and masked spectra, where opaque telluric windows are excluded (white stripes). Panel D: residual spectra after one SysRem pass, where telluric residuals can be observed. Panel E: residual spectra after nine SysRem passes, where most of the telluric contribution has been removed. Nodding position effects were corrected in all panels by interpolating the pixelwavelength solution from nodding position B to position A.
Current usage metrics show cumulative count of Article Views (full-text article views including HTML views, PDF and ePub downloads, according to the available data) and Abstracts Views on Vision4Press platform.
Data correspond to usage on the plateform after 2015. The current usage metrics is available 48-96 hours after online publication and is updated daily on week days.
Initial download of the metrics may take a while.