Fig. 4
Download original image
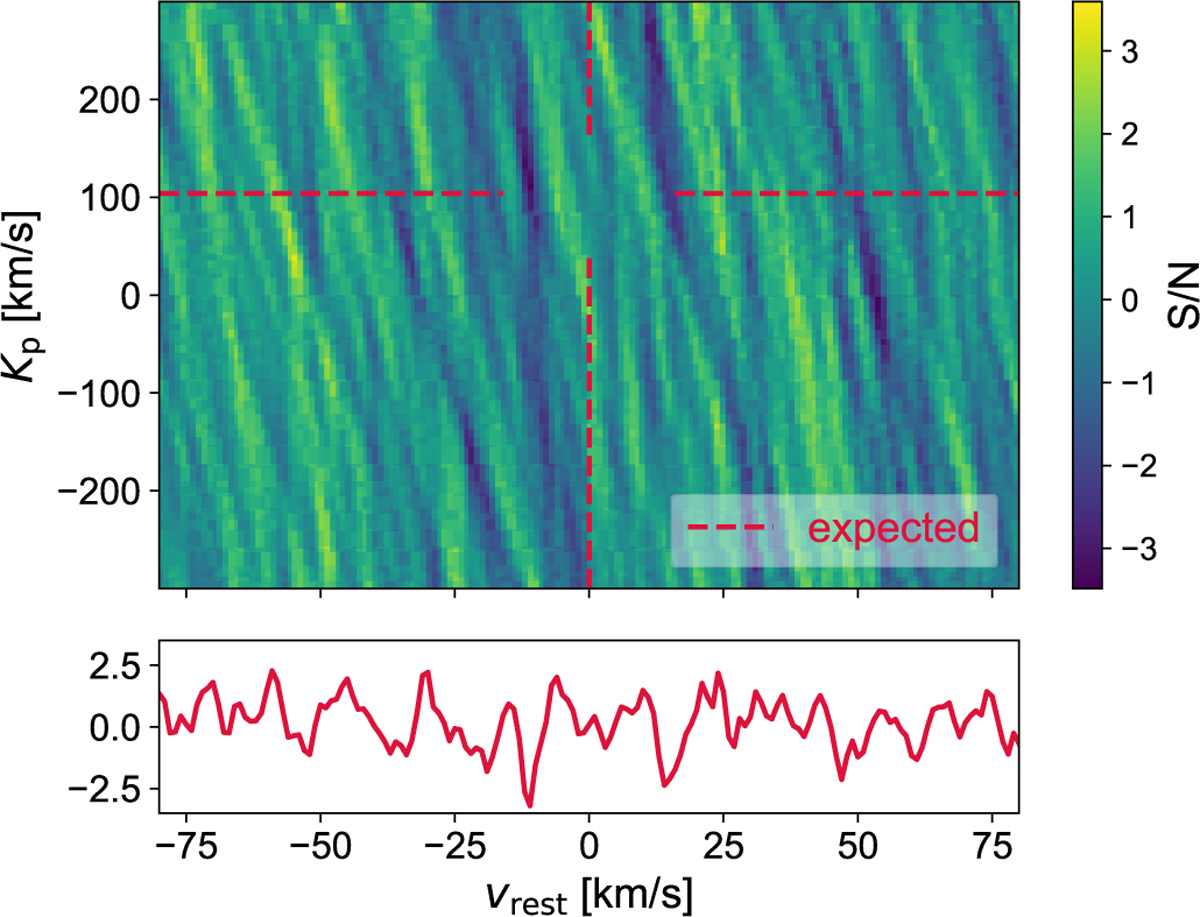
Significance analysis of potential H2O signals, illustrated for the night of 31 March 2022. Top panel: S/N map as a function of radial velocity in the exoplanet’s rest frame (vrest, horizontal axis) and the projected orbital velocity semi-amplitude, Kp (vertical axis). Horizontal lines mark the expected Kp, and vertical lines show the zero rest-frame velocity. Bottom panel: 1D cross-correlation function at the expected Kp (97.1 kms−1)of GJ 1214b.
Current usage metrics show cumulative count of Article Views (full-text article views including HTML views, PDF and ePub downloads, according to the available data) and Abstracts Views on Vision4Press platform.
Data correspond to usage on the plateform after 2015. The current usage metrics is available 48-96 hours after online publication and is updated daily on week days.
Initial download of the metrics may take a while.