Fig. 5
Download original image
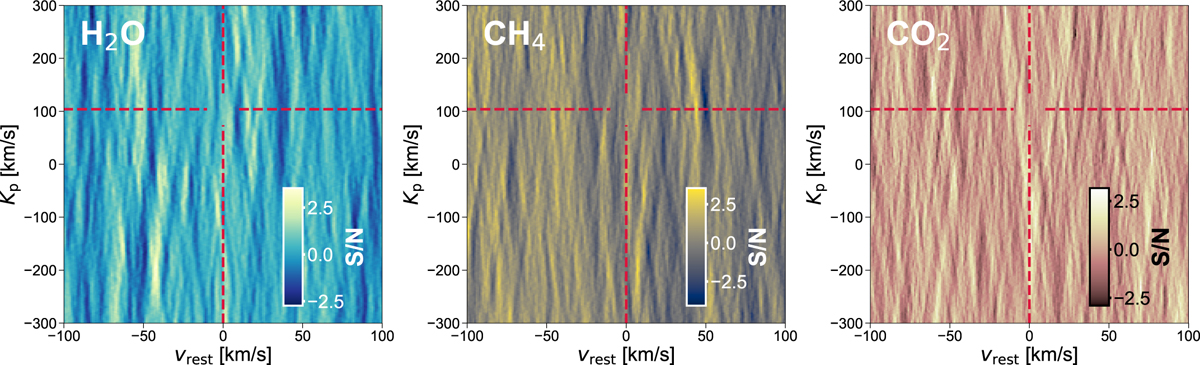
Cross-correlation maps in S/N units for potential atmospheric signals as a function of vrest and Kp for the primary expected absorbing species in the atmosphere of GJ 1214 b. We explored water vapour (left), methane (middle), and carbon dioxide (right). Horizontal and vertical red lines indicate the expected Kp and vrest. These example maps were derived using a 10× solar metallicity template with a cloud deck at 10 mbar. No molecular signals were detected in our cross-correlation analyses.
Current usage metrics show cumulative count of Article Views (full-text article views including HTML views, PDF and ePub downloads, according to the available data) and Abstracts Views on Vision4Press platform.
Data correspond to usage on the plateform after 2015. The current usage metrics is available 48-96 hours after online publication and is updated daily on week days.
Initial download of the metrics may take a while.