Fig. 7
Download original image
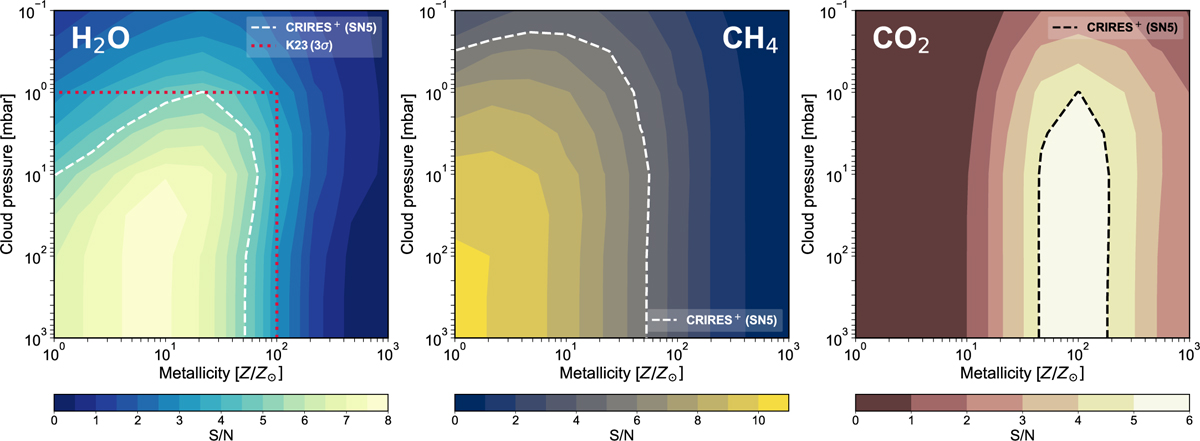
Detectability maps obtained from injection-recovery tests, showing upper limits on the abundances of the main near-infrared strongest absorbers in the atmosphere of G 1214 b. Specifically, we investigate H2O (left panel), CH4 (middle panel), and CO2 (right panel) across a range of metallicities and cloud deck altitudes. Dashed lines indicate the S/N = 5 contours for H2O, CH4, and CO2, as obtained from CRIRES+ (white, eight transits combined). The lower S/N of CO2 recoveries stems from its weaker and fewer lines in the K band, compared to the other infrared absorbers. Red dotted lines indicate the upper limits derived in Kempton et al. (2023) from day and nightside evidences of H2O observed with JWST, in the best-fitting case of reflective clouds and high metallicity.
Current usage metrics show cumulative count of Article Views (full-text article views including HTML views, PDF and ePub downloads, according to the available data) and Abstracts Views on Vision4Press platform.
Data correspond to usage on the plateform after 2015. The current usage metrics is available 48-96 hours after online publication and is updated daily on week days.
Initial download of the metrics may take a while.