Fig. 8
Download original image
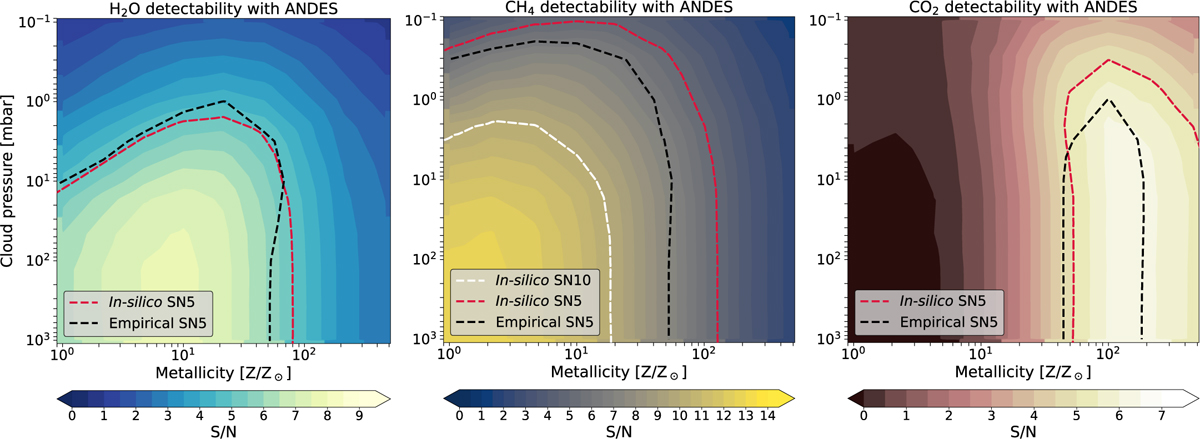
Simulated detectability maps of GJ 1214 b computed with EXoPLORE, assuming a single-transit observation with ANDES on the upcoming ELT. We compute the case of H2O (left), CH4 (middle), and CO2 (right). The white (only for CH4) and red contours indicate recovered S/N levels of 10 and 5 in ANDES in silico data, respectively. For comparison purposes, we also include the S/N = 5 curves (black) obtained from the empirical data analysed in this work (Fig. 7).
Current usage metrics show cumulative count of Article Views (full-text article views including HTML views, PDF and ePub downloads, according to the available data) and Abstracts Views on Vision4Press platform.
Data correspond to usage on the plateform after 2015. The current usage metrics is available 48-96 hours after online publication and is updated daily on week days.
Initial download of the metrics may take a while.