Fig. 1
Download original image
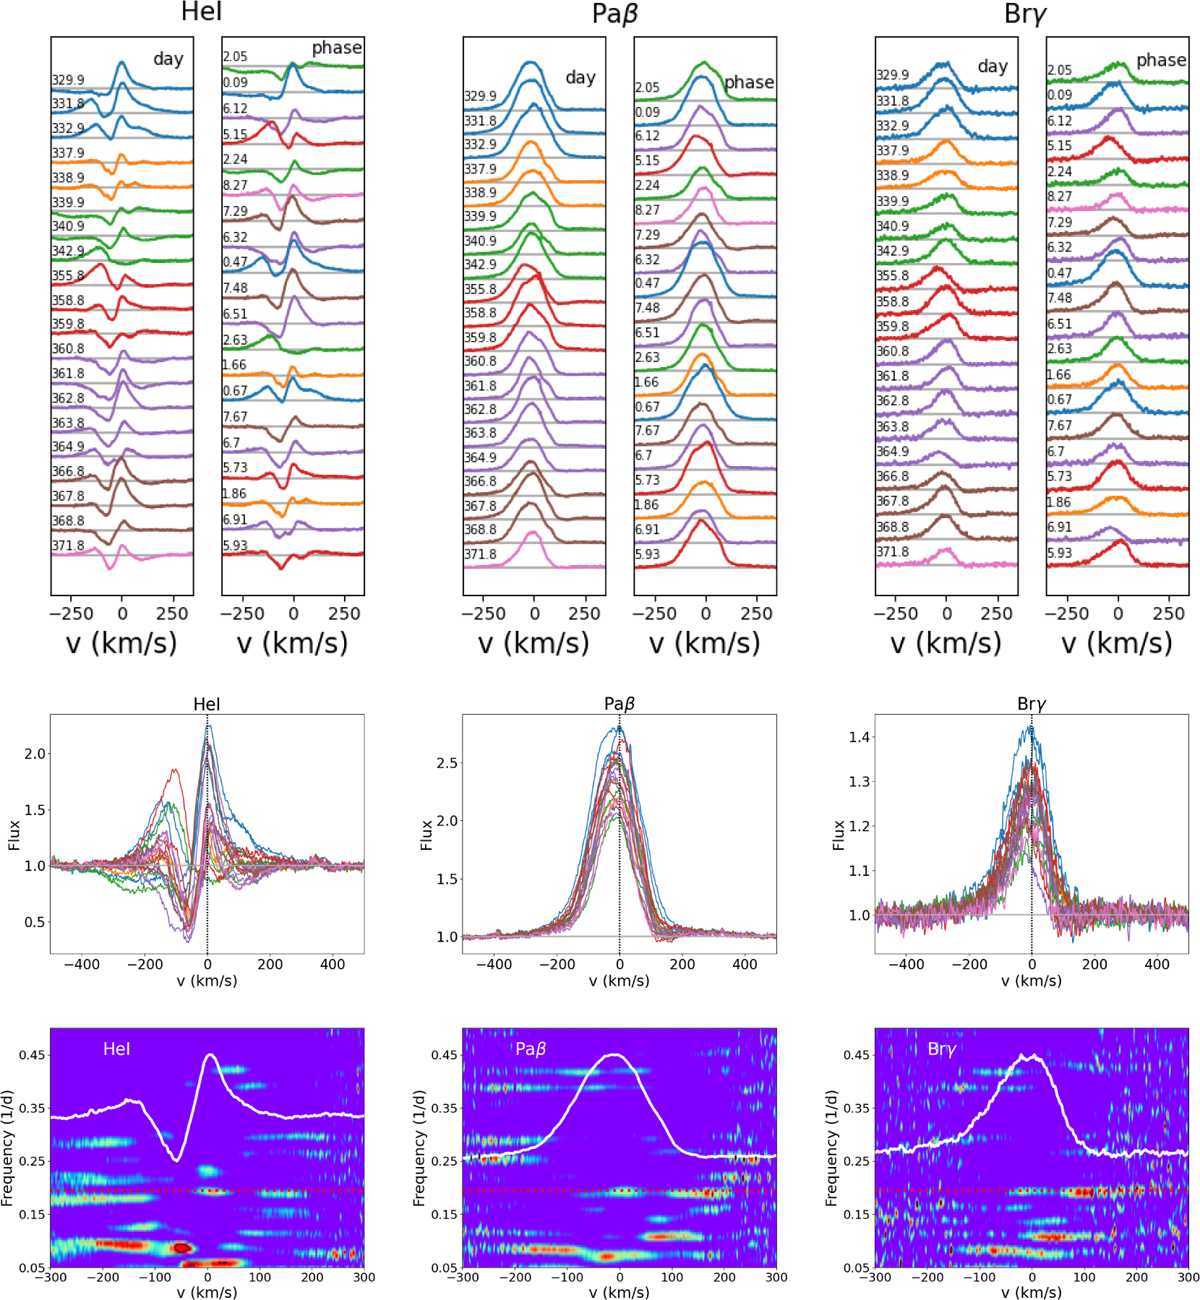
Top: Series of the near-infrared line profiles HeI 1083 nm, Paβ, and Brγ plotted as a function of JD-2 460 000 (left) and rotational phase (right). The color code corresponds to successive rotational cycles. Middle: Plotted profiles superimposed in a single image to illustrate their variability. The vertical dotted line indicates the stellar rest velocity. Bottom: Two-dimensional periodograms across the line profiles. The color code reflects the periodogram power, ranging from 20 (blue) to 60% (red) of the maximum power. The FAP level of 0.1 is shown as black contours. The horizontal dotted red line drawn at a frequency of 0.195 day−1 indicates the star’s rotational period (P = 5.128 d). The white curve is the mean line profile.
Current usage metrics show cumulative count of Article Views (full-text article views including HTML views, PDF and ePub downloads, according to the available data) and Abstracts Views on Vision4Press platform.
Data correspond to usage on the plateform after 2015. The current usage metrics is available 48-96 hours after online publication and is updated daily on week days.
Initial download of the metrics may take a while.