| Issue |
A&A
Volume 708, April 2026
|
|
|---|---|---|
| Article Number | A334 | |
| Number of page(s) | 16 | |
| Section | Interstellar and circumstellar matter | |
| DOI | https://doi.org/10.1051/0004-6361/202558438 | |
| Published online | 22 April 2026 | |
The GRAVITY young stellar object survey
XV. The star-disk interaction region of the T Tauri star DO Tau★
1
Univ. Grenoble Alpes, CNRS, IPAG,
38000
Grenoble,
France
2
Laboratoire Lagrange, Université Côte d’Azur, Observatoire de la Côte d’Azur, CNRS,
Boulevard de l’Observatoire, CS 34229,
06304
Nice Cedex 4,
France
3
Univ. de Toulouse, CNRS, IRAP,
14 avenue Belin,
31400
Toulouse,
France
4
Departamento de Fisica - ICEx - UFMG,
Av. Antônio Carlos 6627,
30270-901
Belo Horizonte,
MG,
Brazil
5
Department of Astronomy, University of Geneva,
Chemin Pegasi, 51,
Versoix
1290,
Switzerland
6
I. Physikalisches Institut, Universität zu Köln,
Zülpicher Strasse 77,
50937
Köln,
Germany
7
Max Planck Institute for Extraterrestrial Physics, Giessenbachstrasse,
85741
Garching bei München,
Germany
8
INAF - Osservatorio Astronomico di Capodimonte,
Salita Moiariello 16,
80131
Napoli,
Italy
9
Max Planck Institute for Astronomy,
Königstuhl 17,
69117
Heidelberg,
Germany
10
University College Dublin (UCD),
Dublin,
Ireland
11
Crimean Astrophysical Observatory,
298409
Nauchny,
Republic of Crimea
12
Konkoly Observatory, HUN-REN Research Centre for Astronomy and Earth Sciences, MTA Centre of Excellence,
Konkoly-Thege Miklós út 15-17,
1121
Budapest,
Hungary
13
Institute of Physics and Astronomy, ELTE Eötvös Loránd University,
Pázmány Péter sétány 1/A,
1117
Budapest,
Hungary
14
Instituto de Astronomía, Universidad Nacional Autónoma de México,
Apdo. Postal 70264,
Ciudad de México
04510,
Mexico
15
Institute of Astronomy and Astrophysics, Academia Sinica,
Roosevelt Rd,
Taipei
10617,
Taiwan
16
Universidade de Lisboa—Faculdade de Ciências,
Campo Grande,
1749-016
Lisboa,
Portugal
17
LIP, Laboratory for Instrumentation and Experimental Particle Physics,
Av. Prof. Gama Pinto 2,
Lisbon
1649-003,
Portugal
18
LIRA, Observatoire de Paris, Université PSL, CNRS, Sorbonne Université, Université Paris Cité,
5 place Jules Janssen,
92195
Meudon,
France
19
Universidade do Porto, Faculdade de Engenharia,
Rua Dr. Roberto Frias,
4200-465
Porto,
Portugal
20
CENTRA—Centro de Astrofísica e Gravitaçâo, IST, Universidade de Lisboa,
1049-001
Lisboa,
Portugal
★★ Corresponding author: This email address is being protected from spambots. You need JavaScript enabled to view it.
Received:
5
December
2025
Accepted:
2
March
2026
Abstract
Context. Protoplanetary disks around young Sun-like stars are the cradles of the vast majority of detected exoplanets. Probing these disks at multiple spatial scales is key to uncovering how planets form. The inner astronomical unit, the star-disk interaction region, is of utmost importance because most detected exoplanets occupy this zone.
Aims. We aim to spatially and spectrally resolve the inner disk and star-disk interaction region of the M0.3 T Tauri star DO Tau by combining two complementary techniques.
Methods. We used high-resolution near-infrared spectra from CFHT/SPIRou to constrain the magnetospheric star-disk interaction process and optical long-baseline interferometry with ESO VLTI/GRAVITY to determine the sizes of the K-band continuum and Brγ line emitting regions. From the SPIRou spectra, we measured the veiling in the YJHK bands along with the equivalent widths of the HeI λ1083, Paβ, and Brγ emission lines, from which we estimated the mass accretion rate. We were able to monitor the time variability of these quantities thanks to our long-sequence of observations over about 40 days. We fit the GRAVITY visibilities in the continuum and the differential quantities in the line with geometrical models to obtain the orientation and the size of the inner disk as well as the size and the on-sky displacement of the Brγ emitting region.
Results. We derived a mass accretion rate of ∼10−8−10−7 M⊙ yr−1, which confirms that this ∼0.5 M⊙ star is a strong accretor. The HI and HeI lines exhibit strong variability on a daily timescale, consistent with the burster classification of DO Tau derived from its K2 light curve. We report a periodic modulation of the intensity of the redshifted high-velocity wings of the Brγ line profile. The modulation occurs at the rotational period of the star (5.128 d), which suggests the existence of corotating magnetospheric funnel flows. We derived an upper limit of 0.35 on the ratio between the magnetospheric truncation radius and the disk corotation radius, indicative of an ordered unstable accretion regime. The size of the Brγ line emitting region obtained from GRAVITY is quite small (RBrγ = 0.011 au ∼ 1.3 R*), and it is much smaller than the K-band continuum emitting region (RK = 0.09 au ∼ 11 R*). Such a compact Brγ emission region suggests that most of the line flux originates from the magnetospheric accretion region and/or from an inner wind close to the magnetosphere-disk interface. The on-sky displacements of the blue and red Brγ line velocity channels suggest a rotation pattern of the emitting gas, as they appear to be nearly aligned along the position angle of the disk. The inclination we derived for the inner disk (∼45-55°) differs from that of the outer disk inferred from the ALMA continuum (∼30°). This points toward a misalignment or warp of the outer disk that may originate from the suspected past encounter with the neighboring HV Tau system.
Conclusions. Based on combining high-resolution spectroscopy and long baseline interferometry, we find that the T Tauri star DO Tau appears to be a strong accretor undergoing magnetospheric accretion in an ordered unstable regime, with a Brγ line emitting region as compact (∼0.01 au) as the size of its magnetosphere.
Key words: accretion, accretion disks / instrumentation: interferometers / circumstellar matter / stars: formation / stars: individual: DO Tau / stars: pre-main sequence
ESO VLTI GTO programs with run ID 110.23TT.002 and 112.25T1.001. Partly based on observations obtained at the Canada-France-Hawaii Telescope (CFHT) which is operated by the National Research Council (NRC) of Canada, the Institut National des Sciences de l'Univers of the Centre National de la Recherche Scientifique (CNRS) of France, and the University of Hawaii. The observations at the CFHT were performed with care and respect from the summit of Maunakea.
© The Authors 2026
 Open Access article, published by EDP Sciences, under the terms of the Creative Commons Attribution License (https://creativecommons.org/licenses/by/4.0), which permits unrestricted use, distribution, and reproduction in any medium, provided the original work is properly cited.
This article is published in open access under the Subscribe to Open model. This email address is being protected from spambots. You need JavaScript enabled to view it. to support open access publication.
1 Introduction
The accretion of matter from the circumstellar disk onto the central star plays a crucial role in the star and planet formation process. It impacts the properties of the central star, its early evolution, and the large amount of energy radiation from accretion shocks that irradiates the circumstellar disk and the protoplanets, thus drastically affecting their physical and chemical evolution. Star and planet formation and disk evolution are intrinsically linked and hence influence each other. In the magnetospheric accretion scenario, the strong stellar magnetic field of young solar-mass T Tauri stars truncates the inner disk out to a few stellar radii, with the accreted matter being funneled onto the star along the magnetic field lines (Bouvier et al. 2007; Hartmann et al. 2016). As the accreting gas falls onto the stellar surface at high speed, the resulting accretion shock(s) and funnel flows can be traced through emission lines in the visible and/or in the near-infrared ranges. The interaction between the star and the inner disk also likely plays a role in the launching and the shaping of large-scale jets or disk winds. Probing the inner astronomical unit around young stars is key to understanding accretion-ejection phenomena and planet formation.
At the distance of the nearest star forming regions (∼140 pc), zooming in on such star-disk interaction scales requires a spatial resolution of a fraction of a milliarcsecond (mas). Reaching this spatial resolution recently became possible with nearinfrared long-baseline interferometry, notably through spectro-astrometry. Using the K-band GRAVITY interferometric instrument (GRAVITY Collaboration 2017) at the combined focus of the Very Large Telescope Interferometer (VLTI), GRAVITY Collaboration (2023a,b), and GRAVITY Collaboration (2024) were able to spatially resolve the innermost disk regions and derive the sizes of the hydrogen I Brγ line emitting regions around about ten T Tauri stars. These sizes range from 0.03 au to 0.24 au (i.e., from 6.5 to 52 R⊙). For these objects, the authors also derived on-sky photocenter displacements of the Brγ line with respect to the continuum of a few hundredths of an astronomical unit, and they traced accretion flows at this spatial scale. Taking benefit from the new hints provided by optical long-baseline interferometry about the sizes and the on-sky photocenter displacements of the emitting regions, Tessore et al. (2023) and Wojtczak et al. (2024) developed two families of radiative transfer models to reproduce the interferometric observations: one based on a pure magnetospheric scenario that reproduces well the observations for low accre-tors (e.g., TW Hya or DoAr 44) and a second one including a disk wind on top of the pure magnetospheric scenario to emulate the observations of stronger accretors (e.g., RU Lup and SCrA N).
High spectral resolution spectroscopy in the optical and in the near-infrared provides proxies to study the accretion-ejection processes (e.g., Alencar et al. 2012; Sousa et al. 2023), and it allows us to investigate the time variability of the emission line profiles formed at least in part in funnel flows, to measure the continuum excess coming from the disk emission in the near-infrared, to estimate the mass accretion rate from the line fluxes, and to determine the epoch when the accretion shock faces the observer. In addition, using spectropolarimeters such as ESPaDOnS (Donati 2003) and SPIRou (Donati et al. 2020) at the Canada-France-Hawaii-Telescope (CFHT) allows the magnetic field strength and large-scale topology to be derived. Hence, high-spectral resolution spectroscopy and high-angular-resolution optical interferometry strongly complement each other. When combined, they provide a powerful framework for drawing a coherent picture of the innermost regions of the protoplanetary disks down to the star-disk interaction region, as already clearly demonstrated by pioneering works (Bouvier et al. 2020a,b; GRAVITY Collaboration 2020, 2024).
This paper presents the first results of an observing campaign on the strongly accreting T Tauri star DO Tau that combines VLTI/GRAVITY and CFHT/SPIRou observations. In Sect. 2, we describe the properties of the object. Section 3 details the nearinfrared spectroscopic observations and results obtained with SPIRou, and in Sect. 4 we describe the GRAVITY K-band interferometric observations and their modeling. We discuss our findings in Sect. 5. The analysis of the spectro-polarimetric SPIRou datasets to monitor the magnetic field topology is presented in a companion paper (Donati et al. 2026).
2 DO Tau, a strong accretor
DO Tau is a low-mass, M0.3 T Tauri star located in the C7-L1527 subgroup of the Taurus cloud (Herczeg & Hillenbrand 2014), at a mean distance of 141.81 pc and an estimated age of 2.59 ± 0.75 Myr (Krolikowski et al. 2021), which is larger than the age of 0.6 Myr derived by Luhman (2023). The large-scale environment of DO Tau is quite complex, with a number of arc-like structures extending over hundreds to thousands of astronomical units, some of which have been interpreted as the remnants of a stellar encounter with the neighboring HV Tau system about 0.1 Myr ago (Winter et al. 2018). Probably due to this complex circumstellar environment, the extinction toward the star is quite uncertain. Estimates range from AV = 0.75 mag (Herczeg & Hillenbrand 2014) to 1.7 mag (Alcalá et al. 2021), and even 3.04 mag (Fischer et al. 2011). In these previous studies, the stellar luminosity L* ranges between 0.23 and 0.4 L⊙, and the stellar radius R* between 1.1 and 1.58 R⊙ (Long et al. 2019; Alcalá et al. 2021). Using ALMA data, Braun et al. (2021) estimated for DO Tau a dynamical mass M* = 0.54 ± 0.07 M⊙ from the Keplerian rotation of its circumstellar disk. In this work, we adopted the effective temperature, gravity, stellar rotational period, and v sin i determined from the SPIRou spectra (Donati et al. 2026), while we assumed the inclination of the star is the same as the inclination of the inner disk we measured here (see Sect. 4.2). From the stellar inclination, rotational period, and v sin i we thus derived a stellar radius R* = 1.8 ± 0.2 R⊙, in agreement with the evolutionary tracks of Feiden (2016) including magnetic field, and a stellar luminosity L* = 0.44 ± 0.2 L⊙. All these stellar parameters are summarized in Table 1 for comparison.
Dodin et al. (2013) reported a strong surface magnetic field for DO Tau, with a longitudinal component amounting to a few hundred Gauss in the narrow component of the HeI line profile at 587.6 nm. Such a strong field may truncate the inner disk and lead to magnetospheric accretion onto the star, as suggested by the appearance of a highly redshifted absorption component in the Paß line profile (Folha & Emerson 2001). In contrast, the HeI 1083 nm line exhibits a pure P-Cygni profile, whose shape suggests the existence of a stellar wind (Kwan et al. 2007). Sousa et al. (2023) derived a barycentric radial velocity Vr = 16.1 ± 0.1 km s−1 from a series of high-resolution near-infrared spectra obtained with SPIRou (Donati et al. 2020), and estimated the mass accretion rate Ṁacc = 2.9 ± 0.5 10−8 M⊙ yr−1 from the Paß and Brγ line fluxes assuming Av = 0.75 mag. This value is similar to earlier estimates computed from optical and nearinfrared line fluxes (e.g., 1.6 10−8 M⊙ yr−1; Gangi et al. 2022), but an order of magnitude lower than the mass accretion rate derived from the UV-optical excess (1.4 10−7 M⊙ yr−1 assuming AV = 2.27 mag; Gullbring et al. 1998). The mass accretion rate may thus vary significantly on a timescale of years and perhaps much shorter, as suggested by Cody et al. (2022)’s classification of the source as a burster from its K2 light curve, indicative of non-steady accretion bursts occurring at the stellar surface. With its high optical and near-infrared veiling, large UV and nearinfrared excesses, wide and strong emission lines (Alcalá et al. 2021 ; Sousa et al. 2023), DO Tau certainly belongs to the class of relatively strong accretors among Class II sources of similar mass.
As for any Class II T Tauri star, DO Tau is surrounded by a gas-rich and dust-rich circumstellar disk. This disk appears to be compact and continuous, with an outer radius of about 80 au measured in scattered light at 1.6 μm (Huang et al. 2022), but only of 36.4 au in the 1.3 mm continuum, with an inclination of 27.6 ± 0.3° and a position angle of 170.0 ± 0.9° (Long et al. 2019). In the CO molecular lines, Braun et al. (2021) reported a disk radius of 202 au. DO Tau is the source of a dense CO outflow whose blueshifted component exhibits multiple rings on a scale of several hundred astronomical units and an associated dynamical timescale of a few hundred years (Fernández-López et al. 2020). The system additionally features a bipolar asymmetric optical jet extending about 170 au from the central star at a position angle of 260 ± 3°, i.e., perpendicular to the position angle of the disk detected in the millimetric range (Erkal et al. 2021). The jet signature is also seen in a number of strongly blueshifted forbidden emission lines in the optical and near-infrared spectrum of the source (e.g., [OI], [SII], and [FeII]), with blueshifted peak velocities reaching up to about −100 km s−1 (Nisini et al. 2024). Erkal et al. (2021) reported that the jet and counter-jet asymmetry and velocities have remained stable over at least 8 years, carrying a mass flux of about 5 × 10⁻⁹ M⊙ yr−1 and originating from an magnetohydrodynamic (MHD) disk wind launched at a distance of less than 0.5 au from the central star.
The inner disk region has been investigated both indirectly through the analysis of specific spectral diagnostics, and directly through long baseline interferometry. Kidder et al. (2021) derived a dust temperature of 1447 ± 110 K at the inner disk edge by fitting the veiling in the H and K bands in the spectral energy distribution. Alcalá et al. (2021) estimated the location of the dust sublimation radius at Rsub = 0.04 ± 0.01 au from their stellar and accretion luminosities, and adopting for the dust sublimation temperature the effective temperature they derived by fitting the veiling variation as a function of the wavelength with a black-body power law. From the two-telescope K-band Keck Interferometer, Eisner et al. (2014) derived an inner dust radius Rdust of 0.18 ± 0.01 au by fitting their two measurements with a uniform ring model. The authors retrieved a size of RBrγ = 0.09 ± 0.01 au for the Brγ emitting region. From the 2.3 μm CO bandheads in emission, they also deduced a maximum size RCO ≤ 0.04 au for the gaseous inner disk edge, which agrees with the CO radius estimate, RCO = 0.03 au, derived by Salyk et al. (2011) from the width of the 4.65-5.10 μm rovibrational CO bandheads at a temperature of 1575 ± 200 K.
Stellar parameters of DO Tau adopted in Long et al. (2019), Alcalá et al. (2021), and this work.
3 Near-infrared spectroscopy
3.1 Observations
We observed DO Tau with SPIRou (Donati et al. 2020), the nearinfrared spectropolarimeter mounted on the 3.6-m CFHT atop Maunakea in Hawaii. SPIRou collects unpolarized and polarized stellar spectra over the 0.95-2.50 μm wavelength range at a resolving power of 70 000 in a single exposure. We obtained 20 spectra between January 19 and March 1, 2024, with an exposure time of 420 s each that yielded a signal-to-noise ratio around 150 in the H band. All spectra were processed with the 0.7.288 version of the SPIRou data reduction software APERO, which also includes telluric correction (Cook et al. 2022). The spectra were normalized to the continuum level. The barycentric stellar radial velocity and veiling in the YJHK bands were computed using a weak-line T Tauri star (TWA 25) as a template of similar spectral type (M0.5, Herczeg & Hillenbrand 2014), following the method described in Sousa et al. (2023). In brief, the template spectrum (Vr = 8.33 ± 0.25 km s−1, Nicholson et al. 2021) is shifted to the observed spectrum of DO Tau over several spectral windows that include unblended photospheric lines and a continuum flux is added until DO Tau’s spectrum is correctly fit through a χ2 method. The wavelength shift measures the radial velocity difference between DO Tau’s and the mean radial velocity of the template, while the added continuum flux measures the veiling in specific wavelength ranges. The veiling r measures the ratio between the excess continuum flux (fexcess) and the photospheric flux (fstar), with the former arising from either the accretion shock (mostly in the UV and optical ranges) or the dust thermal emission (at infrared wavelengths). Its determination allows us to estimate the contribution of the stellar flux to the total flux in the K band (see Sect. 4.2). The template was veiled, rotationally broadened, and shifted in radial velocity to match the spectrum of DO Tau, allowing us to subtract the photospheric lines and compute the residual emission line profiles. The barycentric stellar radial velocity and the veiling in the YJHK bands are given in Table E.1.
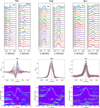 |
Fig. 1 Top: Series of the near-infrared line profiles HeI 1083 nm, Paβ, and Brγ plotted as a function of JD-2 460 000 (left) and rotational phase (right). The color code corresponds to successive rotational cycles. Middle: Plotted profiles superimposed in a single image to illustrate their variability. The vertical dotted line indicates the stellar rest velocity. Bottom: Two-dimensional periodograms across the line profiles. The color code reflects the periodogram power, ranging from 20 (blue) to 60% (red) of the maximum power. The FAP level of 0.1 is shown as black contours. The horizontal dotted red line drawn at a frequency of 0.195 day−1 indicates the star’s rotational period (P = 5.128 d). The white curve is the mean line profile. |
3.2 Results
The main emission lines seen in DO Tau’s near-infrared spectrum are HeI λ1083, and HI Paβ and Brγ. Table E.1 lists their equivalent widths that were measured by direct integration under the residual line profiles and were not corrected for veiling. Additional emission features include the forbidden [FeII] 1257.02 and 1644.00 nm lines and the H2 2121.83 nm line, with the former species blueshifted by −105 km s−1 and the latter by −17 km s−1, therefore presumably originating from the jet and outflow (see Fig. E.1).
Figure 1 shows the variability of the HeI λ1083, Paβ, and Brγ line profiles as a function of date and rotational phase1 during the 2024A SPIRou runs. The HeI line profile exhibits strong variability in both blue and red wings, as well as in its peak intensity. Both blueshifted and redshifted absorptions are clearly seen, extending to nearly −400 and +250 km s−1, respectively, indicative of simultaneous outflow and accretion processes. In contrast, the Paβ and Brγ profiles consist mainly in a single emission component, whose peak intensity varies on a timescale of days. While the profiles are asymmetric with a narrower red wing and a more extended blue wing, only marginal redshifted absorptions can be seen below the continuum on some dates over the velocity range 100-150 km s−1.
A periodogram analysis of the line profiles is shown in the bottom panels of Fig. 1. In the red wing of the Brγ profile, significant power appears at velocities around +100 km s−1 at a frequency corresponding to the stellar rotational period of 5.128 d, with a False Alarm Probability (FAP) peaking at 0.1. This suggests the periodic crossing of corotating funnel flows on the line of sight. While some power is seen at the same location in the Paβ line profile, none of it reaches an FAP of 0.1. In the HeI line profile, the strongest power suggests a longer period of 12 days and is located at negative velocities around −50 km s−1, corresponding to the deepest blueshifted absorption component in the line profile. This signature appears to extend down to −200 km s−1 across the blueshifted wing of the HeI line profile, albeit at a lower significance level (FAP > 0.1). The periodicity seen in the blueshifted wing of the HeI profile may result from a non-axisymmetric outflow originating from a region located beyond the disk corotation radius. Finally, the HeI profile also exhibits some power around zero velocity, extending to ± 40 km s−1, at a period of about 17 days, peaking at FAP of 0.1. Given the limited time span of our observations, namely 42 days interrupted by a 2-week gap, we believe this longer period needs to be confirmed by more extended observations.
Figure 2-top shows the YJHK veiling values as a function of Julian date during the 2024A SPIRou runs. While the veiling is relatively mild in the YJH bands, it increases significantly in the K band. The veiling values in the YJH bands and their weak variations are similar to those previously reported for this source by Sousa et al. (2023) from SPIRou spectra obtained in 2020. Yet, the veiling in the K band has slightly increased compared to these previous epochs, from an average rk = 2.33 in 2020 to rK = 3.0-4.0 in 2024. Figure 2-bottom shows the variations of the HeI λ1083, Paβ, and Brγ line equivalent widths. Little change has occurred in the equivalent widths of the three lines compared to previous observations in 2020 (Sousa et al. 2023). The Paβ and Brγ line equivalent widths vary by a factor of 2-4 on a timescale of days, and we note that the largest line equivalent widths correspond to maximum veiling values, both peaking on JD 2 460 331.805. Indeed, Fig. 3 reveals a clear correlation between the line equivalent widths EW and the nearby continuum veiling r, implying significant line flux variations, since the line flux Fline is proportional to (1 + r) × EW. A periodogram analysis of the veiling-corrected Paβ and Brγ line equivalent widths does not provide any convincing results. Yet when the veiling-corrected EW’s are plotted as a function of rotational phase, as shown in Fig. 4, and regardless of the peak emission occurring at phase 0.47 that likely corresponds to an accretion burst on JD 2 460 331.805 (see above), there is marginal evidence of modulation along the rotational cycle. Interestingly, the minimum line flux occurs near phase 0.3, when the redshifted absorptions are the most conspicuous in the HeI line profile (see Fig. 1), which suggests that the line emitting region is partially hidden from view as the accretion funnel flow crosses the line of sight.
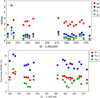 |
Fig. 2 Near-infrared veiling in the YJHK bands (top) and line equivalent widths for the HeI 1083 nm, Paβ, and Brγ line profiles (bottom) as a function of Julian date. The measurement error is usually smaller than the symbol size (see Table E.1). |
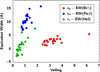 |
Fig. 3 Equivalent width of the HeI, Paβ, and BrG lines as a function of veiling in the JHK bands. Each line is compared to the veiling within the same wavelength range. |
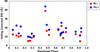 |
Fig. 4 Veiling corrected equivalent widths, EW×(1+r), of the Paβ and Brγ lines as a function of rotational phase. |
3.3 Mass accretion rate
We derived the mass accretion rate from the flux of the nearinfrared lines Paβ and Brγ, which minimizes the impact of the large uncertainties affecting the visual extinction on the line of sight reported in the literature (AV = 0.75-3.04 mag; see Sect. 2). We computed the line flux from the line equivalent widths measured on SPIRou spectra, EW(Paβ) = 7-16 Å and EW(Brγ) = 1.3-5.4 Å, and since we lacked contemporaneous near-infrared photometry, we adopted the J-band and K-band 2MASS magnitudes (J = 9.47, K = 7.3) to estimate the nearby continuum flux2. Assuming a distance of 138.5 pc and propagating the uncertainties on AV3, we derived the line luminosities L(Paβ) = 0.9-3.9 × 1030 erg s−1 and L(Brγ) = 1.68.1 × 1029 erg s−1 for the extreme values of the line equivalent widths. Using the Lacc-Lline relationships of Alcalá et al. (2017), we derived accretion luminosities ranging from 2.1 1032 to 2.4 1033 erg s−1 (0.06-0.4 L⊙). Alternatively, using the Lacc-Lline relationships revisited by Fiorellino et al. (2025), we obtained Lacc = 8.4 × 1032−7.0 × 1033 erg s−1 (0.22-1.8 L⊙).
To compute the mass accretion rate from Eq. (1) of Alcalá et al. (2017), we adopted the dynamical mass M* = 0.54 M⊙ and the radius we derived from the rotational period (R* = 1.8 R⊙; see Sect. 2), as this determination is more accurate than the determination based on the luminosity, as the latter is affected by the uncertainty on extinction. Assuming a truncation radius of 2.5 R* (Pittman et al. 2025), we obtained Ṁacc = 9.6 × 10−91.1 × 10−7 M⊙ yr−1and Ṁacc = 3.8 × 10⁻⁸−3.2 × 10⁻⁷ M⊙ yr−1 when using the Lacc range derived above from the Lacc-Lline relationships of Alcalá et al. (2017) and Fiorellino et al. (2025), respectively. The range of accretion rates thus spans more than an order of magnitude, mostly due to intrinsically varying line fluxes, and is also partly impacted by systematics depending on which Lacc-Lline relationships were selected.
These estimates are consistent with those of previous studies (see Sect. 2) and confirm that DO Tau is a strong accretor, with a mass accretion rate about 10 times larger than the mean accretion rate measured for Class II T Tauri stars of the same mass (see Manara et al. 2023).
Log of the GRAVITY observations of DO Tau.
4 Interferometry
4.1 GRAVITY observations and data reduction
We observed DO Tau with the four Auxiliary Telescopes (ATs) and the four Unit Telescopes (UTs) of the VLTI on December 24, 2022, and on December 28, 2023, respectively, as part of the Guarantee Time Observations of the GRAVITY consortium. We used GRAVITY in its single field mode, with the fringe tracker (FT; Lacour et al. 2019) locking the fringes on DO Tau itself at a frame rate of ∼300 Hz and of ∼900 Hz for the ATs and the UTs, respectively. We used integration times as long as 30 s on the scientific detector of GRAVITY. We recorded 3 files of 6-min each with the medium configuration of the ATs (telescopes D0, G2, J3, and K0), and 10 files of 6-min each with the UTs. All files are recorded with the high spectral resolution mode (R ∼ 4000). These sequences on DO Tau were interleaved with observations on interferometric calibrators to properly calibrate the instrumental transfer function. For the ATs, the weather conditions were excellent with a seeing ranging between 0.52" and 0.68", and a coherence time in the K band up to 39 ms, which allows the GRAVITY fringe tracker to perfectly lock the fringes despite the K-band magnitude of 7.3, which was close to the limiting magnitude with the ATs at that time. For the UTs, the seeing during the observations ranged between 0.48" and 0.77", and the coherence time in the K band was about 7-8 ms. The log of the interferometric observations is given in Table 2. The GRAVITY observations with the UTs were obtained about three weeks before the SPIRou spectropolarimetric observations presented above.
We used the GRAVITY pipeline (Lapeyrere et al. 2014) to reduce and calibrate the observations. We obtained K-band continuum squared visibilities and closure phases for probing the inner rim of the protoplanetary disk (Sect. 4.2), and differential visibilities and phases across the HI Brγ line for studying the accretion-ejection processes in the star-disk interaction region. Despite the excellent weather conditions, the signal-to-noise ratio of the AT observations was not high enough to obtain measurable differential visibilities and phases across the HI Brγ line. We thus only used the higher-quality UT data for modeling the Brγ line emitting region (Sect. 4.3).
4.2 Modeling the K-band continuum emission
In the near-infrared, the continuum emission is dominated by the dust located close to the dust sublimation front. To determine the properties of this K-band emission, as the error bars provided by the GRAVITY reduction pipeline can be underestimated and/or correlated, we conservatively applied 2% floor values to the error estimates on the squared visibilities, and used the geometrical model proposed by Lazareff et al. (2017) as previously used in GRAVITY Collaboration (2019, 2021). It includes three components: a point-like source for the central source, an inner disk modeled as a Gaussian ring, and an extended component, the so-called halo, which is assumed to be fully resolved. As explained in Lazareff et al. (2017), when the inner disk is only partially resolved, its flux contribution and its size are degenerate (see their Sect. 3.4 and their Fig. 4). We therefore used the veiling values rκ derived from SPIRou measurements (see Sect. 3) to fix the starting value for the stellar flux contribution fs and kept it as a free parameter in our fitting process. For rK ranging between 2.5 and 4 (Fig. 2), the stellar flux contribution ranges between 20% and 30%. We fixed the spectral index4 of the star ks from the effective temperature of the star using Table 5 of Pecaut & Mamajek (2013). We are left with seven free parameters: the flux contributions of the extended component fhalo and of the inner disk fd (with fs + fd + fhalo = 1), the spectral index kd, the halfflux radius aK, the inclination i, the position angle PA, and the width-to-half-flux ratio w of the inner disk. The corresponding model for the visibility as a function of spatial frequencies (u, v) and wavelength λ is expressed by
 (1)
(1)
with λ0 the central wavelength of the K band, and Vd the visibility of a pure Gaussian ring to model the inner disk rim (see Appendix C); the visibility of the star equals to 1 as it is a point-like source, and that of the halo is null as it is fully resolved.
We then fit the interferometric quantities by adjusting the free parameters of our model using the same tools as those previously used by Lazareff et al. (2017) and GRAVITY Collaboration (2019, 2021). The χ2 minimization is done through two steps of the Shuffled Complex Evolution algorithm and one final MCMC process, as detailed in Sect. 3.3 of Lazareff et al. (2017).
To derive the inclination i and the position angle PA of the inner disk, we first focused on the AT data only and binned the scientific data exhibiting 5 spectral channels over the K band, as the corresponding (u, v) plane contains two perpendicular short baselines (see Fig. 5-top-right). The circumstellar environment of DO Tau appears to be partially resolved with the AT baselines, with squared visibilities ranging from 0.6 to 0.8. We detect no clear departure from centro-symmetry as the closure phases are consistent with 0. When fitting the squared visibilities with our model, we obtained an inclination i of 49 ± 5° and a PA of 166 ± 5°, which corresponds to an almost north-south direction that is unfortunately not well probed by our (u, v) plane. We obtained a flux contribution for the halo of 11%, and an halfflux radius of 0.7 mas for a star flux contribution of 15%. To refine the size of the environment, we then fixed these values of inclination and position angle, and fit together the AT and UT datasets (Fig. 5), as the visibilities squared for the ATs and the UTs are similar at the shorter baselines (i.e., ∼20 Mλ) despite the different fields of view (i.e., ∼ 250 mas and ∼60 mas for the ATs and the UTs, respectively). Our best-fit corresponds to a χ2 of 0.8, maybe due to a too large floor values of the error estimates. For the best ring model, we obtained a flux contribution of fd = 66%, an half-flux radius aK of 0.62 ± 0.03 mas (i.e., 0.086 ± 0.004 au at 138.5 pc), and a width-to-half flux ratio w consistent with 1, which could be due to our limited angular resolution that prevents us from resolving the inner cavity (if there is one). Regarding the extended component, we derived a flux contribution of fhalo = 12%, while the similar values of the visibilities at the shorter baselines suggest a size on the order of the field of view of the UTs. All the best-model parameters are given in Table 3.
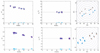 |
Fig. 5 GRAVITY observations of DO Tau with the AT (top) and with the UT (bottom) configurations of the VLTI. The visibilities squared (left) and closure phases (middle) for the central spectral channel of binned data (λ = 2.15 μm) are plotted as a function of the spatial frequency. The corresponding (u, v) planes over the K band are plotted in the right panels. The blue symbols at the bottom of the visibility and closure phase curves display the amplitude of the residuals of the best-fit ring models. See text for detail. |
4.3 Modeling the HI Brγ emitting region
Thanks to the spectral resolution of GRAVITY and the high signal-to-noise ratio reached with the UTs, we were able to observe the HI Brγ line in the K-band spectrum of DO Tau, and to record differential interferometric observables across this emission line (Fig. 6). The Brγ line exhibits a peak line-to-continuum ratio of 1.25, a high-velocity blueshifted wing, and a slight absorption in the red wing that is consistent with accretion (bottom-right panel). For the longest interferometric baselines (U1-U4, U2-U4, and U1-U3), the visibilities across the line are clearly larger than the neighboring continuum visibilities (left panel), which indicates that the Brγ line emitting region is more compact than the continuum one. A non-null differential phase signal across the emission line is detected for three baselines (U2-U3, U1-U3 and U1-U4; middle panel). An S-shape profile is observed for the differential phases on U1-U4 and marginally on U2-U3, which generally traces a rotation process (see for example Mendigutía et al. 2015).
To study the kinematics of the emitting region only, we extracted the pure-line differential visibilities Vline and phases φline using the same method as described in GRAVITY Collaboration (2023c), while the errors are obtained through a classical propagation. Since the Brγ emission is only partially resolved, the on-sky displacements p of each spectral channel with respect to the photocenter of the continuum could be directly obtained from the pure-line phases (Lachaume 2003):
 (2)
(2)
where B are the projected baselines and λ is the wavelength of a given spectral channel. The pure-line phases and the corresponding on-sky displacements are depicted in Fig. 7. The latter draws a line ∼200 μas (i.e., ∼0.03 au) long aligned along the position angle of the inner disk (depicted in yellow). The red and blue channels depart from the zero-velocity channel (white symbol) in the northwest and southeast direction, respectively.
We modeled the pure-line visibilities with the same model as described in GRAVITY Collaboration (2024):
 (3)
(3)
where Ch is the fraction of the total flux attributed to a fully resolved halo component, Θ is the half-width at half-maximum (HWHM) of a Gaussian disk, and Beff is the effective projected baseline which accounts for a potential inclination of the Gaussian disk. This model was adjusted to the Brγ pure-line visibilities in each spectral channel using independent MCMC procedures for each spectral channel running in parallel, where the priors are Gaussian distributions with central values and dispersions set to the continuum best values and associated uncertainties. We used 500 walkers over 2500 steps in order to probe the models’ parameters and reach convergence. Because the Brγ pure-line emission is only partially resolved, there is a degeneracy between Ch and Θ. Therefore, we first adjusted the size of the disk alone, while fixing Ch = 12% as in the continuum (see Sect. 4.2). Once this first convergence was reached, both parameters were let free until a second convergence was reached. We therefore provided a measurement of the typical size for the Brγ emitting region, given that this component is only marginally resolved with GRAVITY. The errors on the best parameters were estimated thanks to the posterior distribution of each parameter (see Fig. D.3 for the corner plot). We obtained a size of RBrγ = 0.011 ± 0.007 au (∼1.4 R*) in the core of the line and a halo contribution similar to that derived for the continuum (10 ± 2%), which is consistent with an origin from light scattering (Pinte et al. 2008). All the parameters of the best model and their uncertainties are listed in Table 3 (see Fig. D.1 for a visibility curve of the best model superimposed to the data).
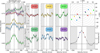 |
Fig. 6 Brγ differential interferometric observables of DO Tau: squared differential visibilities (left) and differential phases (middle) for the six color coded interferometric baselines depicted in the (u, v) plane (upper-right); line-to-continuum flux ratio in the reference frame of the star, LSR-and tellurics-corrected (lower-right). For the interferometric observables, the plots give the median value over the whole observing sequence. Gray shaded regions correspond to the velocities that are not considered for our Brγ line analysis. |
Best-fit parameters and 1σ errors for the K-band and Brγ line emitting regions.
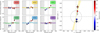 |
Fig. 7 Brγ pure-line differential phases (left) and on-sky photocenter shifts (right) with respect to the continuum photocenter (at (0, 0)) as a function of velocity coded from blue to red. On the pure-line phases, the colored lines correspond to the observed total differential phases. On the photocenter plot, the light-yellow line and cones correspond to the position angle of the inner disk and its uncertainty, respectively. The dotted black circle represents the size of the star. |
5 Discussion
We have spectrally and spatially resolved the star-disk interaction region of DO Tau thanks to near-infrared spectra provided by SPIRou at CFHT, and K-band interferometric measurements with GRAVITY at VLTI. Based on the complementary results brought by these two techniques, we discuss in the following sections the main properties related to the accretion/ejection processes in this young, low-mass star as it interacts with its strongly accreting circumstellar disk.
5.1 The accretion regime
For this low-mass (0.54 M⊙) T Tauri star, we derived a mass accretion rate in the range ~10−8−10−7 M⊙ yr−1, classifying DO Tau as a relatively strong accretor. When looking at the line flux of the Paβ and Brγ lines over the sequence of observations, we found evidence of a periodic modulation in the redshifted, high velocity wings of the profiles at the rotational period of the star of 5.128 d. This suggests the presence of large-scale accretion funnel flows persistent over at least seven rotational periods of the system. The HI and HeI near-infrared line profiles exhibit significant variability on a timescale of days. The latter has deep absorption features seen in both the blue and the red wings, with no clear sign of phase consistency from one rotational period to the next. This suggests significant variations of the mass accretion rate onto the star on short timescales, as also indicated by the burster-type K2 light curve the source displays (Cody et al. 2022). This finding is supported by the low ratio between the magnetic truncation radius and the corotation radius. Using the rotational period and stellar mass listed in Table 1, we computed a corotation radius, i.e., the location where the Keplerian velocity of the disk equals the stellar angular velocity, Rcor ~ 0.047±0.002 au ~ 5.6 R*. To compute the magnetospheric truncation radius Rmag, where the stellar magnetic field truncates the inner disk, we used the formula from Hartmann et al. (2016):
 (4)
(4)
where the dipolar magnetic field contribution at the equator Bd is scaled to 3 kG, the stellar radius R* to 2 R⊙, the stellar mass M* to 0.5 M⊙, and the mass accretion rate Ṁacc to 10−8 M⊙ yr−1. With the parameters of Table 1, we obtained a Rmag range of 0.008-0.016 au (∼1-2 R*) for a dipolar magnetic field strength Bd of 0.3 kG derived from the SPIRou observations (Donati et al. 2026). The upper limit of Rmag does not exceed 2 R*, leading to a ratio Rmag/Rcor below 0.34, indicative of an ordered unstable accretion regime (Blinova et al. 2016). According to the simulations presented by these authors, in this regime, chaotic unstable accretion tongues merge to form one or two “ordered” accretion tongues that penetrate into the magnetosphere where they transition into regular funnel flows. In the case of a large inclination of the magnetic axis relative to the stellar rotational axis, as was the case for DO Tau in 2024 (β ~ 50°; Donati et al. 2026), Kulkarni & Romanova (2008, 2009) showed that the instability is reduced because the magnetic pole is closer to the disk plane, making it easier to load the accreting material onto the magnetic field lines. Then, a modulation at the stellar rotation period is expected and this would account for the rotational modulation of the accretion flow we detected in the high-velocity redshifted wings of the line profiles at the stellar rotation period (see Sect. 3.2).
5.2 The origin of the Brγ emission line
From the GRAVITY measurements, we derived a very compact size for the Brγ line emitting region (RBrγ = 0.011 ± 0.007 au ~ 1.4 R*) of the same order as the magnetospheric truncation radius (see Fig. 8). While our simple geometrical modeling of the Brγ interferometric visibilities may underestimate the actual size of the magnetospheric cavity by up to a factor 2 compared to radiative transfer models of magnetospheric Brγ emission (Tessore et al. 2023), the corotation radius (Rcor ~ 5.6 R*) remains much larger. This suggests that the Brγ emission is dominated by magnetospheric accretion and/or an inner wind at the magnetosphere-disk interface (e.g., Najita et al. 2000). When comparing with the modeling of Wojtczak et al. (2024), the constant Brγ size across blue to red spectral channels of the emission line (see Appendix D) favors their pure magnetospheric accretion scenario, as a disk wind contribution increases the size in the line wings (see GRAVITY Collaboration 2024, for the example of the strong accretor S CrA North). Nevertheless, Wojtczak et al. (2024) only considered a disk wind (starting at 7-9 R*) and did not model a wind launched very close to the star. In addition, the SPIRou He I line profiles exhibit a clear blueshifted absorption (see first column of Fig. 1) that is either narrow or large (up to −300 km/s), which suggests the presence of both a disk wind and a stellar and/or inner wind (Kwan et al. 2007). This is corroborated by previous spectroscopic observations of DO Tau (Alencar & Basri 2000; Banzatti et al. 2019; Nisini et al. 2024) that are well modeled by a conical-shell inner wind (Kurosawa & Romanova 2012). The Brγ emission of DO Tau might thus partially include a contribution of outflowing material very close to the stellar surface.
The on-sky photocenter shifts across the Brγ emission line provided by GRAVITY lie along the position angle of the disk (Fig. 7). As detailed in Tessore et al. (2023), these displacements can trace the accretion flow along the rotation of the star and of the magnetosphere. GRAVITY observations were acquired at a rotational phase of the system corresponding to 0.77 in Tessore et al. (2023)'s modeling5. We can use their 3D radiative transfer simulations computed at a rotational phase of 0.69 (see their Fig. 5), closest in phase to the GRAVITY observations, as they considered an inclination of 60°, close to that of DO Tau (∼49°). Our on-sky displacements (orientation and amplitude) exhibit a similar slight misalignment with the disk’s position angle as predicted from their radiative transfer model at this rotational phase. However, we cannot completely rule out another scenario (e.g., a stellar and/or inner wind), as the obliquity of the magnetic field of DO Tau (∼50°; Donati et al. 2026) is higher than what is considered in their simulations (obliquity of 10°).
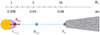 |
Fig. 8 Characteristic sizes for DO Tau: HWHM of Brγ emitting region RBrγ (red square), magnetospheric truncation radius Rmag (purple area), corotation radius Rcor (blue circle), and half-flux radius of the K-band continuum emission RK (gray). |
5.3 The inner rim of the disk
In the near-infrared range, the continuum emission is dominated by the rim of the inner disk where the dust is sublimated by the irradiation of the central star. We first estimated the expected sublimation radius Rsub (in au) for DO Tau from the relationship provided by Monnier & Millan-Gabet (2002):
 (5)
(5)
which yields Rsub ranging between 0.02 and 0.06 au for a stellar luminosity of 0.44 ± 0.08 L⊙, a typical sublimation temperature of silicates Tsub between 1300 K and 1700 K, and a ratio of the absorption efficiencies of the dust of the incident field and of the reemitted field QR = 3 for an effective temperature of about 3500 K (see Fig. 2 of Monnier & Millan-Gabet 2002). Although roughly similar within uncertainties, this sublimation radius (0.02-0.06 au) is 1.4-4 times smaller than the half-flux radius determined from GRAVITY observations (0.086 ± 0.004 au; see Sect. 4.2). We then developed radiative transfer models with MCMax (Min et al. 2009) for different dust populations and found that a single population of small (0.1 μm) olivine grains or a mix of small (0.1 μm) olivine and iron grains provide inner rim positions consistent with the GRAVITY half-flux radius measurement (see Appendix E for a detailed description of the model). Alternatively, since DO Tau is a strong accretor, the inner rim could include larger grains and be driven further out due to hot accretion spot(s) on the stellar surface and/or viscous heating: when taking into account the accretion luminosity Lacc (Sect. 3.3) in Eq. (5) in addition to the stellar luminosity, we obtained sublimation radii as large as 0.1 au, consistent with GRAVITY’s continuum measurement. Eisner et al. (2014) derived a size about twice as large, Rsub = 0.18 ± 0.01 au, which may be due to the fact that they neglected the halo contribution, thus overestimated the continuum ring size (Pinte et al. 2008). Alternatively, DO Tau might have been in a different accretion regime at the time of their observations with enhanced heating processes, as the authors determined a Brγ equivalent width of 11.9 Å, i.e., nearly three times as large as the values we derived here.
5.4 A misalignment of the outer disk
From the GRAVITY data, we determined an inclination for the inner disk of 45-55°, which is larger than the inclination of the outer disk as derived with ALMA (27.6°; Long et al. 2019). A higher inclination for the star is also more consistent with the magnetic field map reconstructed from Zeeman-Doppler imaging (Donati et al. 2026). It is also more in agreement with its fundamental parameters, as using the ALMA disk’s inclination for the star would lead to a stellar radius of 2.8 R⊙, which disagrees with the tracks from Feiden (2016) for a star with the mass, gravity, and effective temperature of DO Tau, as listed in Table 1. As previously observed for LkCa 15 (Alencar et al. 2018), RX J1604.3-2130A (Sicilia-Aguilar et al. 2020), and DoAr 44 (Bouvier et al. 2020b), the inclinations of the central star and of the inner part of the disk appear to be similar, while the outer disk is misaligned.
Although warps and misalignments of protoplanetary disks are common (Marino et al. 2015; Benisty et al. 2017; Bohn et al. 2022), the origin of such morphologies is still a matter of debate. Among the mechanisms that could generate a warp of the disk, an interaction between the disk and a tilted magnetosphere has been invoked to explain the light curve of AA Tau (Bouvier et al. 1999; Terquem & Papaloizou 2000). In the grid of 3D magnetohydrodynamic simulations performed by Romanova et al. (2021), different angles of misalignment (5-10°, and up to 30-40°) between the stellar rotation axis and the normal of the disk could be obtained depending on the initial position of the inner disk, the rotational period, and the magnetic moment of the star.
Another possibility to generate a warp is the presence of a companion on an inclined orbit (Nealon et al. 2020). This scenario has been investigated by Erkal et al. (2021) to account for the slight jet wiggling they detected in their observations in the [Fe II] line at 1644 nm, as wiggling is generally expected to trace the dynamical impact of an unseen companion. As the faster, redshifted jet exhibits a larger wiggling amplitude than the blueshifted one, the authors ruled out the “orbital scenario” (Masciadri & Raga 2002), where the wiggling originates from the reflex motion of the jet source under the influence of the companion. Erkal et al. (2021) also investigated the “precession scenario” (Terquem & Papaloizou 2019), where the jet wiggling could trace the disk precession due to tidal interactions with a companion in a non-coplanar orbit, and found that it is not fully in agreement with the observations either. They thus favored a precession induced by a warping instability driven by magnetic torques, which agrees well with the variability of the magnetic field topology of DO Tau over month- to year-timescales detected with SPIRou observations (Donati et al. 2026).
Dullemond et al. (2019) and Kuffmeier et al. (2021) proposed that the misalignment of the outer disk could be the result of late infall events during which matter is accreted with a misaligned angular momentum. This scenario sounds plausible, when considering the complex environment of DO Tau with arclike structures and the suspected past stellar encounter with the neighboring HV Tau system (Winter et al. 2018).
Accurately locating the disk’s warp would aid toward understanding its origin. Unfortunately, this is not reachable with the existing datasets, since the protoplanetary disk of DO Tau is probed at the ∼0.1 au scale with GRAVITY and at a few tens of astronomical units with ALMA. Complementing these datasets with MATISSE observations on intermediate scales would potentially provide a full sampling of the disk structure.
6 Conclusions
By combining spectroscopic and K-band interferometric observations of the T Tauri star DO Tau, we spatially and spectrally resolved the central astronomical unit of the system, and this allowed us to investigate the physical processes at play in the star-disk interaction region. Our main conclusions are as follows:
With a mass accretion rate of 10−8−10−7 M⊙ yr−1, we confirm that this low-mass (∼0.5 M⊙) star is a strong accretor. We found a periodic modulation of the high-velocity red-shifted wing of the HI Brγ line profile at the stellar rotational period, which suggests the existence of corotating accretion funnel flows linking the inner disk to the stellar surface. We derived a ratio Rmag/Rcor of 0.34 or less, which points toward an ordered unstable accretion regime, as expected for a star classified as a burster;
The size we measured for the Brγ line emitting region is very compact (∼0.01 au). It is much smaller than the size of the K-band continuum emitting region (∼0.09 au) and on the order of the magnetospheric truncation radius. This suggests a dominant contribution of magnetospheric accretion and/or a wind originating very close to the star for the Brγ emission;
The on-sky displacements we measured across the Brγ emission line profile are almost aligned along the PA of the disk on a scale of ∼200 μ-arcseconds (i.e., ∼0.03 au), and they possibly trace a corotating magnetospheric accretion flow;
We derived an inclination for the inner disk that agrees with the star’s inclination, and it is larger by 15-25° than that of the outer disk. This points to a misalignment of the outer disk that could be related to the past encounter between DO Tau and the close by HV Tau system.
The results reported here demonstrate that the magnetospheric accretion process extends down to low-mass strongly accreting T Tauri stars, such as DO Tau. They illustrate the power of combining contemporaneous (and ideally simultaneous) high-resolution spectroscopic and long baseline interferometric observations to probe the physical processes at play at the star-disk interaction region of young stellar systems. The companion paper (Donati et al. 2026) provides even further constraints by deriving, through spectropolarimetric analysis, the magnetic strength and topology of the large-scale stellar magnetic field responsible for this interaction.
Data availability
SPIRou data used in this study are, or will soon be, publicly available at the Canadian Astronomy Data Center (https://www.cadc-ccda.hia-iha.nrc-cnrc.gc.ca/). The GRAVITY data are publicly available in the ESO archive (https://archive.eso.org/).
Acknowledgements
We thank the anonymous referee for the fruitful suggestions that improved the paper. We thank George Pantolmos for enlightening discussions on the unstable accretion regime in young stars and Myriam Benisty for fruitful discussions. This work has been supported by the French National Research Agency (ANR) in the framework of the “Investissements d’Avenir” program (ANR-15-IDEX-02) and in the framework of the “ANR-23-EDIR0001-01” project (IRYSS project). This research has made use of the Jean-Marie Mariotti Center Aspro (http://www.jmmc.fr/aspro) and SearchCal (http://www.jmmc.fr/searchcal) services co-developed by LAGRANGE and IPAG, and of CDS Astronomical Databases SIMBAD and VIZIER (http://cdsweb.u-strasbg.fr/). This work has made use of data from the European Space Agency (ESA) mission Gaia (https://www.cosmos.esa.int/gaia), processed by the Gaia Data Processing and Analysis Consortium (DPAC, https://www.cosmos.esa.int/web/gaia/dpac/consortium). Funding for the DPAC has been provided by national institutions, in particular the institutions participating in the Gaia Multilateral Agreement. A.C.G. acknowledges the support from PRIN-MUR 2022 20228JPA3A “The path to star and planet formation in the JWST era (PATH)” funded by NextGeneration EU and by INAF-GoG 2022 “NIR-dark Accretion Outbursts in Massive Young stellar objects (NAOMY)” and Large Gran INAF-2024 “Spectral Key features of Young stellar objects: Wind-Accretion LinKs Explored in the infraRed (SKYWALKER)”. A.K. acknowledges support by the NKFIH NKKP grant ADVANCED 149943 and the NKFIH excellence grant TKP2021-NKTA-64. Project no. 149943 has been implemented with the support provided by the Ministry of Culture and Innovation of Hungary from the National Research, Development and Innovation Fund, financed under the NKKP ADVANCED funding scheme. A.A and P.G. acknowledge support from FundaçÅo para a Ciência e Tecnologia (FCT), Portugal, through grants UID/99/2025 and UID/50007/2025. L.L. and E.B. gratefully acknowledge the Collaborative Research Center 1601 funded by the Deutsche Forschungsgemeinschaft (DFG, German Research Foundation)–SFB 1601 [sub-project A3].
References
- Alcalá, J. M., Manara, C. F., Natta, A., et al. 2017, A&A, 600, A20 [NASA ADS] [CrossRef] [EDP Sciences] [Google Scholar]
- Alcalá, J. M., Gangi, M., Biazzo, K., et al. 2021, A&A, 652, A72 [NASA ADS] [CrossRef] [EDP Sciences] [Google Scholar]
- Alencar, S. H. P., & Basri, G. 2000, AJ, 119, 1881 [NASA ADS] [CrossRef] [Google Scholar]
- Alencar, S. H. P., Bouvier, J., Walter, F. M., et al. 2012, A&A, 541, A116 [NASA ADS] [CrossRef] [EDP Sciences] [Google Scholar]
- Alencar, S. H. P., Bouvier, J., Donati, J. F., et al. 2018, A&A, 620, A195 [NASA ADS] [CrossRef] [EDP Sciences] [Google Scholar]
- Ansdell, M., Williams, J. P., van der Marel, N., et al. 2016, ApJ, 828, 46 [Google Scholar]
- Banzatti, A., Pascucci, I., Edwards, S., et al. 2019, ApJ, 870, 76 [Google Scholar]
- Benisty, M., Stolker, T., Pohl, A., et al. 2017, A&A, 597, A42 [NASA ADS] [CrossRef] [EDP Sciences] [Google Scholar]
- Blinova, A. A., Romanova, M. M., & Lovelace, R. V. E. 2016, MNRAS, 459, 2354 [Google Scholar]
- Bohn, A. J., Benisty, M., Perraut, K., et al. 2022, A&A, 658, A183 [NASA ADS] [CrossRef] [EDP Sciences] [Google Scholar]
- Bouvier, J., Chelli, A., Allain, S., et al. 1999, A&A, 349, 619 [NASA ADS] [Google Scholar]
- Bouvier, J., Alencar, S. H. P., Boutelier, T., et al. 2007, A&A, 463, 1017 [NASA ADS] [CrossRef] [EDP Sciences] [Google Scholar]
- Bouvier, J., Alecian, E., Alencar, S. H. P., et al. 2020a, A&A, 643, A99 [EDP Sciences] [Google Scholar]
- Bouvier, J., Perraut, K., Le Bouquin, J.-B., et al. 2020b, A&A, 636, A108 [NASA ADS] [CrossRef] [EDP Sciences] [Google Scholar]
- Braun, T. A. M., Yen, H.-W., Koch, P. M., et al. 2021, ApJ, 908, 46 [NASA ADS] [CrossRef] [Google Scholar]
- Cody, A. M., Hillenbrand, L. A., & Rebull, L. M. 2022, AJ, 163, 212 [NASA ADS] [CrossRef] [Google Scholar]
- Cook, N. J., Artigau, É., Doyon, R., et al. 2022, PASP, 134, 114509 [NASA ADS] [CrossRef] [Google Scholar]
- Dodin, A. V., Lamzin, S. A., & Chuntonov, G. A. 2013, Astrophys. Bull., 68, 177 [Google Scholar]
- Donati, J. F. 2003, in Astronomical Society of the Pacific Conference Series, 307, Solar Polarization, eds. J. Trujillo-Bueno, & J. Sanchez Almeida, 41 [Google Scholar]
- Donati, J. F., Kouach, D., Moutou, C., et al. 2020, MNRAS, 498, 5684 [Google Scholar]
- Donati, J.-F., Cristofari, P. I., Carmona, A., et al. 2026, A&A, 708, A230 [NASA ADS] [CrossRef] [EDP Sciences] [Google Scholar]
- Dorschner, J., Begemann, B., Henning, T., Jaeger, C., & Mutschke, H. 1995, A&A, 300, 503 [Google Scholar]
- Dullemond, C. P., Küffmeier, M., Goicovic, F., et al. 2019, A&A, 628, A20 [NASA ADS] [CrossRef] [EDP Sciences] [Google Scholar]
- Eisner, J. A., Hillenbrand, L. A., & Stone, J. M. 2014, MNRAS, 443, 1916 [Google Scholar]
- Erkal, J., Dougados, C., Coffey, D., et al. 2021, A&A, 650, A46 [NASA ADS] [CrossRef] [EDP Sciences] [Google Scholar]
- Feiden, G. A. 2016, A&A, 593, A99 [NASA ADS] [CrossRef] [EDP Sciences] [Google Scholar]
- Fernández-López, M., Zapata, L. A., Rodríguez, L. F., et al. 2020, AJ, 159, 171 [Google Scholar]
- Fiorellino, E., Alcalá, J. M., Manara, C. F., et al. 2025, A&A, 704, A42 [NASA ADS] [CrossRef] [EDP Sciences] [Google Scholar]
- Fischer, W., Edwards, S., Hillenbrand, L., & Kwan, J. 2011, ApJ, 730, 73 [Google Scholar]
- Folha, D. F. M., & Emerson, J. P. 2001, A&A, 365, 90 [NASA ADS] [CrossRef] [EDP Sciences] [Google Scholar]
- Gaia Collaboration (Smart, R. L., et al.) 2021, A&A, 649, A6 [EDP Sciences] [Google Scholar]
- Gangi, M., Antoniucci, S., Biazzo, K., et al. 2022, A&A, 667, A124 [NASA ADS] [CrossRef] [EDP Sciences] [Google Scholar]
- GRAVITY Collaboration (Abuter, R., et al.) 2017, A&A, 602, A94 [NASA ADS] [CrossRef] [EDP Sciences] [Google Scholar]
- GRAVITY Collaboration (Perraut, K., et al.) 2019, A&A, 632, A53 [NASA ADS] [CrossRef] [EDP Sciences] [Google Scholar]
- GRAVITY Collaboration (Garcia Lopez, R., et al.) 2020, Nature, 584, 547 [Google Scholar]
- GRAVITY Collaboration (Perraut, K., et al.) 2021, A&A, 655, A73 [NASA ADS] [CrossRef] [EDP Sciences] [Google Scholar]
- GRAVITY Collaboration (Soulain, A., et al.) 2023a, A&A, 674, A203 [NASA ADS] [CrossRef] [EDP Sciences] [Google Scholar]
- GRAVITY Collaboration (Wojtczak, J. A., et al.) 2023b, A&A, 669, A59 [Google Scholar]
- GRAVITY Collaboration (Wojtczak, J. A., et al.) 2023c, A&A, 669, A59 [Google Scholar]
- GRAVITY Collaboration (Nowacki, H., et al.) 2024, A&A, 690, A123 [Google Scholar]
- Gullbring, E., Hartmann, L., Briceño, C., & Calvet, N. 1998, ApJ, 492, 323 [Google Scholar]
- Hartmann, L., Herczeg, G., & Calvet, N. 2016, ARA&A, 54, 135 [Google Scholar]
- Herczeg, G. J., & Hillenbrand, L. A. 2014, ApJ, 786, 97 [Google Scholar]
- Huang, J., Ginski, C., Benisty, M., et al. 2022, ApJ, 930, 171 [NASA ADS] [CrossRef] [Google Scholar]
- Kama, M., Min, M., & Dominik, C. 2009, A&A, 506, 1199 [NASA ADS] [CrossRef] [EDP Sciences] [Google Scholar]
- Kidder, B., Mace, G., López-Valdivia, R., et al. 2021, ApJ, 922, 27 [NASA ADS] [CrossRef] [Google Scholar]
- Klarmann, L. A. 2018, PhD thesis, University of Amsterdam, The Netherlands [Google Scholar]
- Krolikowski, D. M., Kraus, A. L., & Rizzuto, A. C. 2021, AJ, 162, 110 [NASA ADS] [CrossRef] [Google Scholar]
- Kuffmeier, M., Dullemond, C. P., Reissl, S., & Goicovic, F. G. 2021, A&A, 656, A161 [NASA ADS] [CrossRef] [EDP Sciences] [Google Scholar]
- Kulkarni, A. K., & Romanova, M. M. 2008, MNRAS, 386, 673 [Google Scholar]
- Kulkarni, A. K., & Romanova, M. M. 2009, MNRAS, 398, 701 [Google Scholar]
- Kurosawa, R., & Romanova, M. M. 2012, MNRAS, 426, 2901 [NASA ADS] [CrossRef] [Google Scholar]
- Kwan, J., Edwards, S., & Fischer, W. 2007, ApJ, 657, 897 [Google Scholar]
- Lachaume, R. 2003, A&A, 400, 795 [NASA ADS] [CrossRef] [EDP Sciences] [Google Scholar]
- Lacour, S., Dembet, R., Abuter, R., et al. 2019, A&A, 624, A99 [NASA ADS] [CrossRef] [EDP Sciences] [Google Scholar]
- Lapeyrere, V., Kervella, P., Lacour, S., et al. 2014, Proc. SPIE, 9146, 91462D [Google Scholar]
- Lazareff, B., Berger, J. P., Kluska, J., et al. 2017, A&A, 599, A85 [NASA ADS] [CrossRef] [EDP Sciences] [Google Scholar]
- Long, F., Herczeg, G. J., Harsono, D., et al. 2019, ApJ, 882, 49 [Google Scholar]
- Luhman, K. L. 2023, AJ, 165, 37 [NASA ADS] [CrossRef] [Google Scholar]
- Manara, C. F., Ansdell, M., Rosotti, G. P., et al. 2023, in Astronomical Society of the Pacific Conference Series, 534, Protostars and Planets VII, eds. S. Inutsuka, Y. Aikawa, T. Muto, K. Tomida, & M. Tamura, 539 [Google Scholar]
- Marino, S., Perez, S., & Casassus, S. 2015, ApJ, 798, L44 [Google Scholar]
- Masciadri, E., & Raga, A. C. 2002, ApJ, 568, 733 [Google Scholar]
- Mathis, J. S., Rumpl, W., & Nordsieck, K. H. 1977, ApJ, 217, 425 [Google Scholar]
- Mendigutía, I., de Wit, W. J., Oudmaijer, R. D., et al. 2015, MNRAS, 453, 2126 [CrossRef] [Google Scholar]
- Min, M., Dullemond, C. P., Dominik, C., de Koter, A., & Hovenier, J. W. 2009, A&A, 497, 155 [NASA ADS] [CrossRef] [EDP Sciences] [Google Scholar]
- Monnier, J. D., & Millan-Gabet, R. 2002, ApJ, 579, 694 [Google Scholar]
- Najita, J. R., Edwards, S., Basri, G., & Carr, J. 2000, in Protostars and Planets IV, eds. V. Mannings, A. P. Boss, & S. S. Russell, 457 [Google Scholar]
- Nealon, R., Cuello, N., Gonzalez, J.-F., et al. 2020, MNRAS, 499, 3857 [Google Scholar]
- Nicholson, B. A., Hussain, G., Donati, J.-F., et al. 2021, MNRAS, 504, 2461 [NASA ADS] [CrossRef] [Google Scholar]
- Nisini, B., Gangi, M., Giannini, T., et al. 2024, A&A, 683, A116 [NASA ADS] [CrossRef] [EDP Sciences] [Google Scholar]
- Park, W., Lee, J.-E., Contreras Peña, C., et al. 2021, ApJ, 920, 132 [NASA ADS] [CrossRef] [Google Scholar]
- Pecaut, M. J., & Mamajek, E. E. 2013, ApJS, 208, 9 [Google Scholar]
- Pinte, C., Ménard, F., Berger, J. P., Benisty, M., & Malbet, F. 2008, ApJ, 673, L63 [NASA ADS] [CrossRef] [Google Scholar]
- Pittman, C. V., Espaillat, C. C., Robinson, C. E., et al. 2025, ApJ, 992, 134 [Google Scholar]
- Pollack, J. B., Hollenbach, D., Beckwith, S., et al. 1994, ApJ, 421, 615 [Google Scholar]
- Romanova, M. M., Koldoba, A. V., Ustyugova, G. V., et al. 2021, MNRAS, 506, 372 [NASA ADS] [CrossRef] [Google Scholar]
- Salyk, C., Blake, G. A., Boogert, A. C. A., & Brown, J. M. 2011, ApJ, 743, 112 [NASA ADS] [CrossRef] [Google Scholar]
- Sicilia-Aguilar, A., Manara, C. F., de Boer, J., et al. 2020, A&A, 633, A37 [NASA ADS] [CrossRef] [EDP Sciences] [Google Scholar]
- Sousa, A. P., Bouvier, J., Alencar, S. H. P., et al. 2023, A&A, 670, A142 [NASA ADS] [CrossRef] [EDP Sciences] [Google Scholar]
- Terquem, C., & Papaloizou, J. C. B. 2000, A&A, 360, 1031 [NASA ADS] [Google Scholar]
- Terquem, C., & Papaloizou, J. C. B. 2019, MNRAS, 482, 530 [Google Scholar]
- Tessore, B., Soulain, A., Pantolmos, G., et al. 2023, A&A, 671, A129 [NASA ADS] [CrossRef] [EDP Sciences] [Google Scholar]
- Winter, A. J., Booth, R. A., & Clarke, C. J. 2018, MNRAS, 479, 5522 [Google Scholar]
- Woitke, P., Min, M., Pinte, C., et al. 2016, A&A, 586, A103 [NASA ADS] [CrossRef] [EDP Sciences] [Google Scholar]
- Wojtczak, J. A., Tessore, B., Labadie, L., et al. 2024, A&A, 689, A124 [NASA ADS] [CrossRef] [EDP Sciences] [Google Scholar]
The ephemeris for the rotational phase is computed with Prot=5.128 d and an origin of phase on JD 2 460 329.412, just before the first SPIRou spectrum. This ensures that the fractional phases used in this paper are the same as in the accompanying paper (Donati et al. 2026).
We could not find more recent K-band magnitude measurements in the literature. However, Park et al. (2021) provide 13 measurements of WISE W1 (3.6 μm) photometry for DO Tau obtained between Feb. 2014 and Apr. 2020. The mean value is W1 = 6.10 mag and the standard deviation is 0.16 mag, which suggests that DO Tau's near-infrared flux does not drastically vary over the years.
The large range of AV from 0.75 to 3.04 mag results in a factor of 1.8 uncertainty in L(Paβ) and of 1.3 in L(Brγ).
The spectral index is defined as  , with F the flux and ν the frequency.
In Tessore et al. (2023), phase 0.5 refers to the epoch when the main accretion column faces the observer. This corresponds to phase ~0.3 of our ephemeris, when the deepest redshifted absorptions are seen in the line profiles (Fig. 1). The GRAVITY observations were obtained at phase 0.57 according to our ephemeris, which corresponds to a rotational phase of ~0.77 in Tessore et al. (2023)'s definition.
Appendix A SPIRou spectra: Radial velocity, veiling, and equivalent width measurements
Table E.1 lists the radial velocity, veiling in the YJHK bands, and equivalent width for the HeI, Paβ, and Brγ lines. These measurements are extracted for each SPIRou spectrum.
Appendix B Fe[II] and H2 lines in the SPIRou spectra
Fig. E.1 shows the Fe[II] 1257.02 and 1644.00 nm, and the H2 2121.83 nm line profiles from the SPIRou spectra. For each line, all the spectra are superimposed to monitor the variability over the observing sequence.
Appendix C Ring model for the K-band emission
To model the K-band continuum emission from the inner rim where dust grains sublimate, we convolve a wireframe image with an ellipsoidal kernel with a Gaussian radial distribution, as described in detail in Sect. 3.6 of Lazareff et al. (2017). The wireframe distribution has a complex visibility given by (their Eq. 7)
 (C.1)
(C.1)
and the Gaussian kernel has a complex visibility given by (see their Table 5)
 (C.2)
(C.2)
with ar the ring angular radius, and aG the kernel angular radius. The resulting complex visibility is
 (C.3)
(C.3)
The physical quantities (see their Table 7) are the half-flux radius  and the width-to-half-flux ratio w = aG /aK.
Appendix D Brγ emission best-fit model
Once extracted, the pure-line visibilities are modeled by Eq. (3) given in Sect. 4.3. The best-fit model and the corresponding residuals are displayed in Fig. D.1. The sizes derived for each velocity are given in Table D.1 and illustrated in Fig. D.2. We give the corner plot of the associated MCMC process in Fig. D.3.
Half-width at half-maximum and contribution of halo (Ch) of the Brγ emission for each velocity channel with 1σ errors.
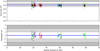 |
Fig. D.1 Top: Pure-line visibility squared as a function of the spatial frequency: GRAVITY measurements for the six baselines (colored symbols as in Fig. 4) and best-fit model (continuous blue line), surrounded by its 3σ uncertainty (gray shaded area). Bottom: Residuals of best-fit model expressed in units of uncertainties of the data. |
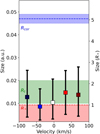 |
Fig. D.2 Half-width at half-maximum of the best Gaussian disk model for the Brγ line emitting region as a function of the spectral channel. For comparison, the red, green and blue areas illustrate the stellar, the magnetospheric truncation, and the corotation radius, respectively. |
Appendix E Self-consistent disk models
We used the radiative transfer code MCMax (Min et al. 2009) to compute the structure of protoplanetary disks with different dust properties around DO Tau. MCMax offers a self-consistent treatment of dust sublimation: the dust density structure is solved by iterating the radiative transfer, dust sublimation and recondensation, and vertical hydrostatic equilibrium (Kama et al. 2009). In our simulations, the star was modeled based on the measured parameters of DO Tau (M* = 0.54 M⊙, Teff = 3500 K, L* = 0.44 L⊙, i = 49°; see Table 1). We used initial disk boundaries from 0.001 to 200 au, and a power law distribution Σ(r) ∝ r−1.5 for the initial radial profile of the dust surface density. The dust mass in the disk was set at 10 M⊕, close to the mean of 15 ± 3 M⊕ found around T Tauri stars in the 1-3 Myr Lupus complex (Ansdell et al. 2016). Four different dust compositions were tested:
a single population (100%) of small (0.1 μm) olivine grains,
a mix (80%/20%) of small (0.1 μm) and large (100 μm) olivine grains, respectively,
a MRN (Mathis et al. 1977) distribution of olivine grains (2% of 0.1 μm, 4% of 1 μm, 10% of 10 μm, 24% of 100 μm, and 60% of 1 mm),
a mix (99%/1%) of small (0.1 μm) olivine and iron grains, respectively.
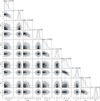 |
Fig. D.3 Corner plot associated with the MCMC process performed on pure-line quantities. The contribution of the halo and the half-width at half maximum for a given velocity v are denoted as |

We used the amorphous olivine opacities of Dorschner et al. (1995) and iron opacities of Pollack et al. (1994). Adopting the DIANA standard values of Woitke et al. (2016), the grains have a porosity of 25% and a maximum hollow volume of 80%. Thermodynamic parameters for both materials come from Pollack et al. (1994). After 150 iterations, following Klarmann (2018) and taking into account the inclination of the star, we extracted the radii where the dust surface density reaches 10, 50, and 90% of its peak (RSD, relevant for planetary formation); the radii inside which 10, 50, and 90% of the 2.2 μm near-infrared flux is emitted (RNIRF, relevant for interferometric observations); and the radii where the optical depth in the midplane reaches 0.1, 1, and 10 (RODM, relevant for radiative transfer modeling). All the values are gathered in Table E.2.
Photospheric radial velocity, near-infrared veiling in the YJHK bands and equivalent widths of the HeI 1083 nm, Paβ, and Brγ lines listed with their 1 σ error.
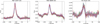 |
Fig. E.1 Line profiles of Fe[II] 1257.02 and 1644.00 nm and H2 2121.83 nm from the SPIRou spectra. The color code corresponds to successive rotational cycles. The emission line profiles have not been corrected from underlying photospheric lines. |
The density and temperature maps from these simulations are shown in Fig. E.2, along with the modeled and measured radii and widths of the inner rim. When looking at RNIRF, the modeled radii range from 0.02 to 0.09 au, the closest radii with our measurement (0.086 ± 0.004 au) being found for the small-grain models (pure olivine and olivine-iron mix). It is worth mentioning that the accretion luminosity is not taken into account in these models. This may push the inner rim radii further out and make the large-grain model more in line with the GRAVITY half-flux radius.
Radius and width of the inner rim extracted from the surface density (RSD), near-infrared flux (RNIRF), and optical depth at midplane (RODM) modeled with MCMax for four different dust populations.
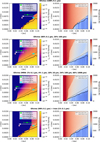 |
Fig. E.2 Density (left column) and temperature (right column) maps of the MCMax disk models for four different dust populations. The solid and dotted lines show the vertical and radial optically thin transitions at 2.2 pm, respectively. The green, white, and pink bars show the inner rim radii and widths extracted from the surface density, near-infrared flux, and optical depth at mid-plane, respectively. The cyan diamond and bar correspond to the GRAVITY measurement presented in this paper. The vertical position of the bars is arbitrary. |
All Tables
Stellar parameters of DO Tau adopted in Long et al. (2019), Alcalá et al. (2021), and this work.
Half-width at half-maximum and contribution of halo (Ch) of the Brγ emission for each velocity channel with 1σ errors.
Photospheric radial velocity, near-infrared veiling in the YJHK bands and equivalent widths of the HeI 1083 nm, Paβ, and Brγ lines listed with their 1 σ error.
Radius and width of the inner rim extracted from the surface density (RSD), near-infrared flux (RNIRF), and optical depth at midplane (RODM) modeled with MCMax for four different dust populations.
All Figures
|
Fig. 1 Top: Series of the near-infrared line profiles HeI 1083 nm, Paβ, and Brγ plotted as a function of JD-2 460 000 (left) and rotational phase (right). The color code corresponds to successive rotational cycles. Middle: Plotted profiles superimposed in a single image to illustrate their variability. The vertical dotted line indicates the stellar rest velocity. Bottom: Two-dimensional periodograms across the line profiles. The color code reflects the periodogram power, ranging from 20 (blue) to 60% (red) of the maximum power. The FAP level of 0.1 is shown as black contours. The horizontal dotted red line drawn at a frequency of 0.195 day−1 indicates the star’s rotational period (P = 5.128 d). The white curve is the mean line profile. |
| In the text | |
|
Fig. 2 Near-infrared veiling in the YJHK bands (top) and line equivalent widths for the HeI 1083 nm, Paβ, and Brγ line profiles (bottom) as a function of Julian date. The measurement error is usually smaller than the symbol size (see Table E.1). |
| In the text | |
|
Fig. 3 Equivalent width of the HeI, Paβ, and BrG lines as a function of veiling in the JHK bands. Each line is compared to the veiling within the same wavelength range. |
| In the text | |
|
Fig. 4 Veiling corrected equivalent widths, EW×(1+r), of the Paβ and Brγ lines as a function of rotational phase. |
| In the text | |
|
Fig. 5 GRAVITY observations of DO Tau with the AT (top) and with the UT (bottom) configurations of the VLTI. The visibilities squared (left) and closure phases (middle) for the central spectral channel of binned data (λ = 2.15 μm) are plotted as a function of the spatial frequency. The corresponding (u, v) planes over the K band are plotted in the right panels. The blue symbols at the bottom of the visibility and closure phase curves display the amplitude of the residuals of the best-fit ring models. See text for detail. |
| In the text | |
|
Fig. 6 Brγ differential interferometric observables of DO Tau: squared differential visibilities (left) and differential phases (middle) for the six color coded interferometric baselines depicted in the (u, v) plane (upper-right); line-to-continuum flux ratio in the reference frame of the star, LSR-and tellurics-corrected (lower-right). For the interferometric observables, the plots give the median value over the whole observing sequence. Gray shaded regions correspond to the velocities that are not considered for our Brγ line analysis. |
| In the text | |
|
Fig. 7 Brγ pure-line differential phases (left) and on-sky photocenter shifts (right) with respect to the continuum photocenter (at (0, 0)) as a function of velocity coded from blue to red. On the pure-line phases, the colored lines correspond to the observed total differential phases. On the photocenter plot, the light-yellow line and cones correspond to the position angle of the inner disk and its uncertainty, respectively. The dotted black circle represents the size of the star. |
| In the text | |
|
Fig. 8 Characteristic sizes for DO Tau: HWHM of Brγ emitting region RBrγ (red square), magnetospheric truncation radius Rmag (purple area), corotation radius Rcor (blue circle), and half-flux radius of the K-band continuum emission RK (gray). |
| In the text | |
|
Fig. D.1 Top: Pure-line visibility squared as a function of the spatial frequency: GRAVITY measurements for the six baselines (colored symbols as in Fig. 4) and best-fit model (continuous blue line), surrounded by its 3σ uncertainty (gray shaded area). Bottom: Residuals of best-fit model expressed in units of uncertainties of the data. |
| In the text | |
|
Fig. D.2 Half-width at half-maximum of the best Gaussian disk model for the Brγ line emitting region as a function of the spectral channel. For comparison, the red, green and blue areas illustrate the stellar, the magnetospheric truncation, and the corotation radius, respectively. |
| In the text | |
|
Fig. D.3 Corner plot associated with the MCMC process performed on pure-line quantities. The contribution of the halo and the half-width at half maximum for a given velocity v are denoted as |
| In the text | |
|
Fig. E.1 Line profiles of Fe[II] 1257.02 and 1644.00 nm and H2 2121.83 nm from the SPIRou spectra. The color code corresponds to successive rotational cycles. The emission line profiles have not been corrected from underlying photospheric lines. |
| In the text | |
|
Fig. E.2 Density (left column) and temperature (right column) maps of the MCMax disk models for four different dust populations. The solid and dotted lines show the vertical and radial optically thin transitions at 2.2 pm, respectively. The green, white, and pink bars show the inner rim radii and widths extracted from the surface density, near-infrared flux, and optical depth at mid-plane, respectively. The cyan diamond and bar correspond to the GRAVITY measurement presented in this paper. The vertical position of the bars is arbitrary. |
| In the text | |
Current usage metrics show cumulative count of Article Views (full-text article views including HTML views, PDF and ePub downloads, according to the available data) and Abstracts Views on Vision4Press platform.
Data correspond to usage on the plateform after 2015. The current usage metrics is available 48-96 hours after online publication and is updated daily on week days.
Initial download of the metrics may take a while.