Fig. 5
Download original image
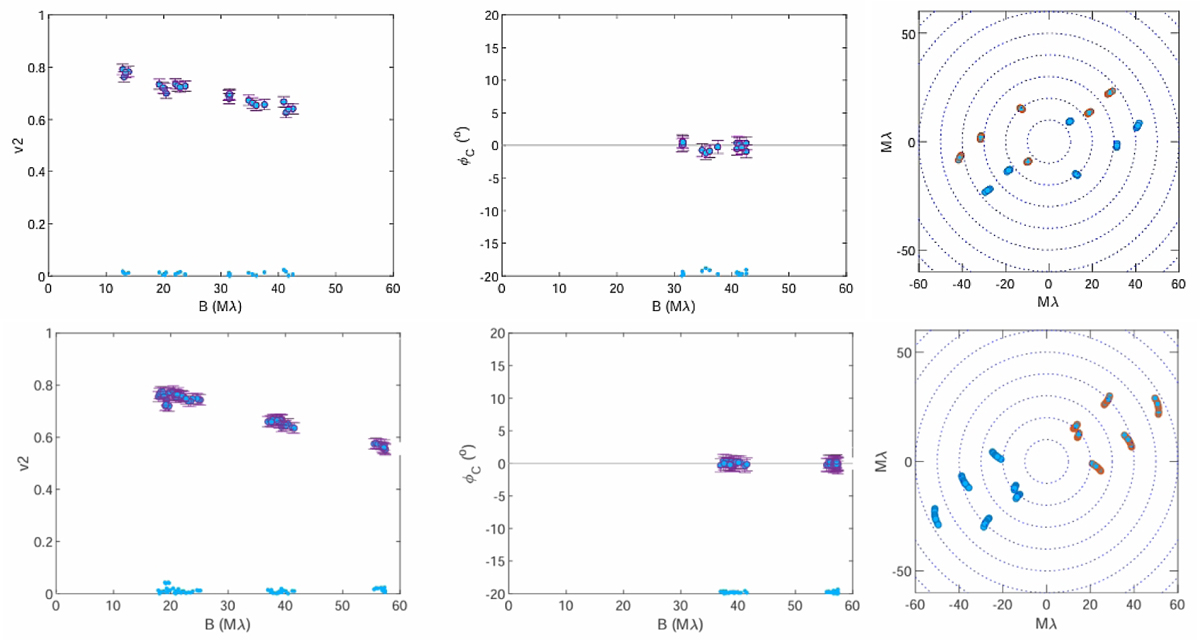
GRAVITY observations of DO Tau with the AT (top) and with the UT (bottom) configurations of the VLTI. The visibilities squared (left) and closure phases (middle) for the central spectral channel of binned data (λ = 2.15 μm) are plotted as a function of the spatial frequency. The corresponding (u, v) planes over the K band are plotted in the right panels. The blue symbols at the bottom of the visibility and closure phase curves display the amplitude of the residuals of the best-fit ring models. See text for detail.
Current usage metrics show cumulative count of Article Views (full-text article views including HTML views, PDF and ePub downloads, according to the available data) and Abstracts Views on Vision4Press platform.
Data correspond to usage on the plateform after 2015. The current usage metrics is available 48-96 hours after online publication and is updated daily on week days.
Initial download of the metrics may take a while.