Fig. 7
Download original image
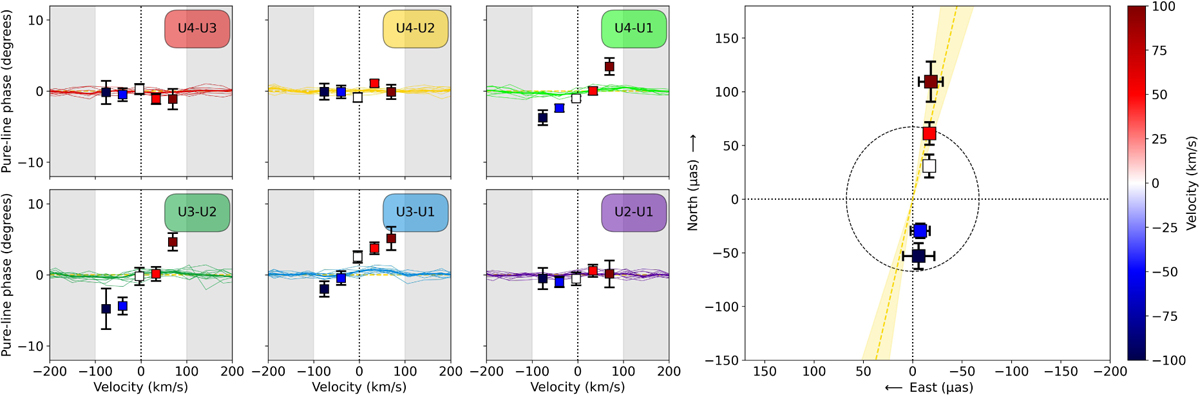
Brγ pure-line differential phases (left) and on-sky photocenter shifts (right) with respect to the continuum photocenter (at (0, 0)) as a function of velocity coded from blue to red. On the pure-line phases, the colored lines correspond to the observed total differential phases. On the photocenter plot, the light-yellow line and cones correspond to the position angle of the inner disk and its uncertainty, respectively. The dotted black circle represents the size of the star.
Current usage metrics show cumulative count of Article Views (full-text article views including HTML views, PDF and ePub downloads, according to the available data) and Abstracts Views on Vision4Press platform.
Data correspond to usage on the plateform after 2015. The current usage metrics is available 48-96 hours after online publication and is updated daily on week days.
Initial download of the metrics may take a while.