Fig. 2.
Download original image
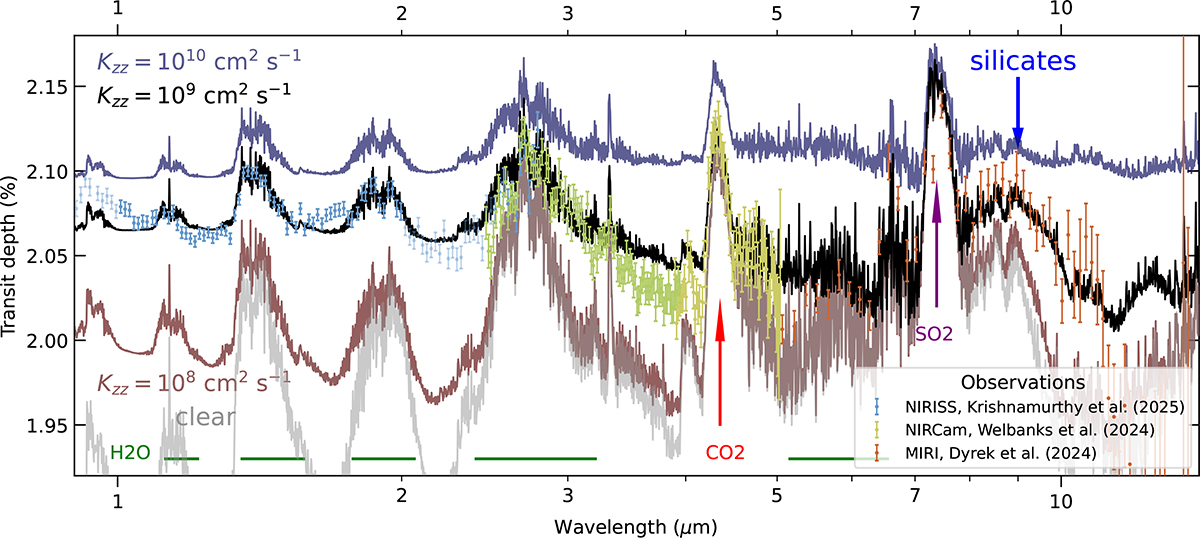
JWST observations of WASP-107 b (colored vertical bars) along with the best-fit model (black line; Kzz = 109 cm2 s−1), resulting in a ![]() . The NIRISS observations are shifted vertically by 130 ppm to match the NIRCam data at the wavelengths where they overlap. The runs with higher and lower Kzz are shown with blue and brown lines, respectively, to illustrate the spectroscopic effects of varying the turbulent diffusivity. The simulated spectrum of a cloudless atmosphere is plotted in gray.
. The NIRISS observations are shifted vertically by 130 ppm to match the NIRCam data at the wavelengths where they overlap. The runs with higher and lower Kzz are shown with blue and brown lines, respectively, to illustrate the spectroscopic effects of varying the turbulent diffusivity. The simulated spectrum of a cloudless atmosphere is plotted in gray.
Current usage metrics show cumulative count of Article Views (full-text article views including HTML views, PDF and ePub downloads, according to the available data) and Abstracts Views on Vision4Press platform.
Data correspond to usage on the plateform after 2015. The current usage metrics is available 48-96 hours after online publication and is updated daily on week days.
Initial download of the metrics may take a while.