Fig. 3.
Download original image
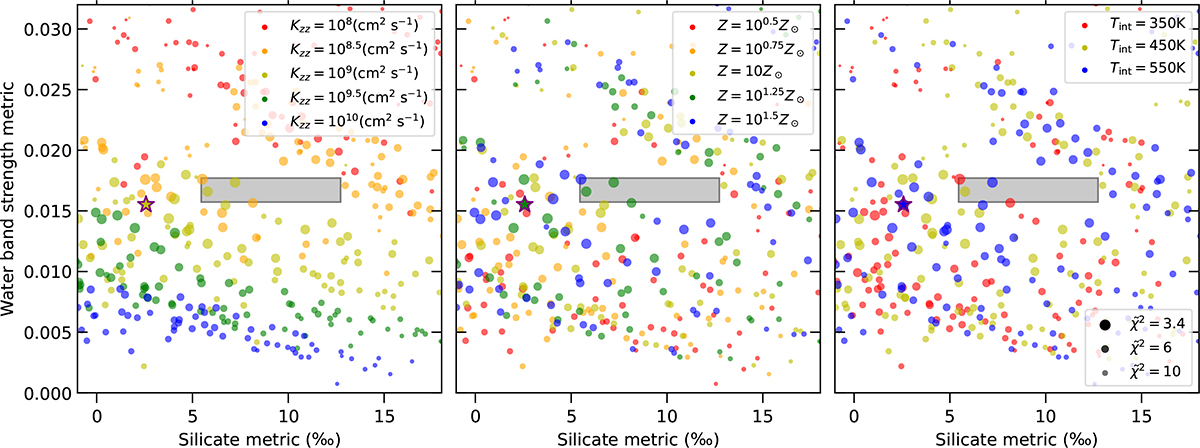
Scatter plots demonstrating how the near-IR H2O line strength and the 10 μm silicate metric depend on the diffusivity parameter (Kzz; left), metallicity (Z; middle), and internal energy flux (Tint; right) model parameters. The size of the dots corresponds to the ![]() of their fits to the JWST observations. The gray rectangle corresponds to the JWST observational data and their 1σ uncertainties. The best-fit model run (star) is in 2σ agreement with the observation.
of their fits to the JWST observations. The gray rectangle corresponds to the JWST observational data and their 1σ uncertainties. The best-fit model run (star) is in 2σ agreement with the observation.
Current usage metrics show cumulative count of Article Views (full-text article views including HTML views, PDF and ePub downloads, according to the available data) and Abstracts Views on Vision4Press platform.
Data correspond to usage on the plateform after 2015. The current usage metrics is available 48-96 hours after online publication and is updated daily on week days.
Initial download of the metrics may take a while.