Fig. 1
Download original image
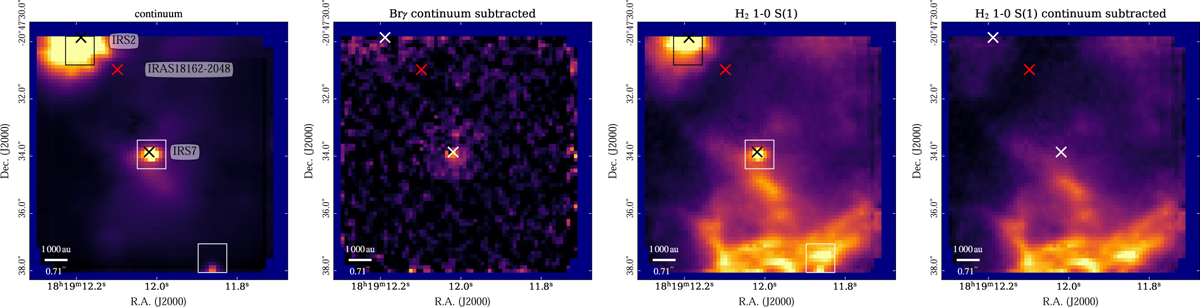
Left: SINFONI K band continuum view of the IRAS 18162-2048 star-forming region. The black and white boxes represent the extraction regions for the spectra shown in Fig. 2. The black crosses represent the positions of IRS 2 and IRS 7 (peak intensity pixel from SINFONI), and the red cross shows the position of IRAS 18162-2048 (from the VLA data). Middle left: peak intensity continuum-subtracted map for the Brγ emission line. The white crosses represent the positions of IRS 2 and IRS 7, and the red cross indicates the position of IRAS 18162-2048. Middle right: peak intensity map for the 1–0 S(1) H2 emission line including the continuum emission. Right: same as middle-right panel but with the continuum subtracted. In all panels, the full FoV of SINFONI is shown.
Current usage metrics show cumulative count of Article Views (full-text article views including HTML views, PDF and ePub downloads, according to the available data) and Abstracts Views on Vision4Press platform.
Data correspond to usage on the plateform after 2015. The current usage metrics is available 48-96 hours after online publication and is updated daily on week days.
Initial download of the metrics may take a while.