Fig. 10
Download original image
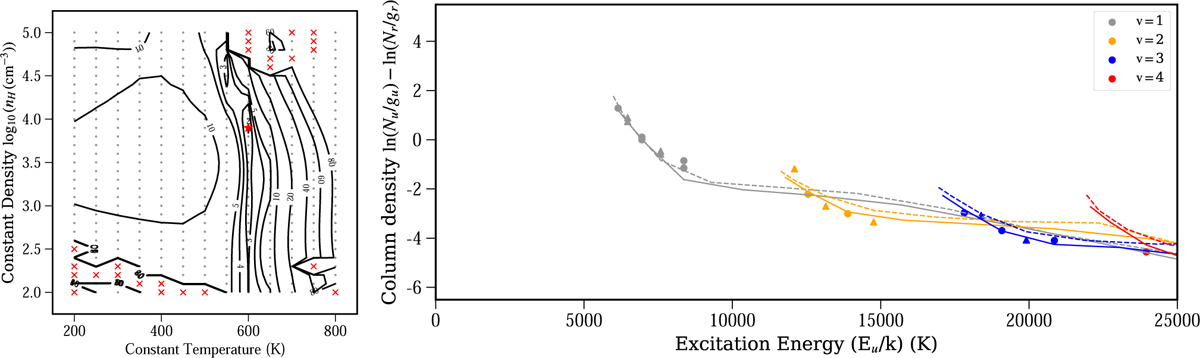
Left: χ2 map for the grid run of constant density and constant temperature with Cloudy. The red star represents the model with the lowest χ2 of 1.94 (see text). The red crosses mark the grid values where the Cloudy code raised a failure flag of failed assert or cloudy abort. Right: Ro-vibrational diagram of H2 comparing our observations (markers) with the best Cloudy model (lines) for T = 600 K and log10(nH /cm−3) = 3.9. Both models and observations have been normalised to the column density over the statistical weight of the 1–0 S(1) line at 2.12 µm (i.e. Nr/gr). Markers and lines are colour-coded by vibrational level (v), and circles and solid lines represent ortho- transitions, whereas triangles and dashed lines are for para-transitions.
Current usage metrics show cumulative count of Article Views (full-text article views including HTML views, PDF and ePub downloads, according to the available data) and Abstracts Views on Vision4Press platform.
Data correspond to usage on the plateform after 2015. The current usage metrics is available 48-96 hours after online publication and is updated daily on week days.
Initial download of the metrics may take a while.