Press Release
Open Access
Fig. 2
Download original image
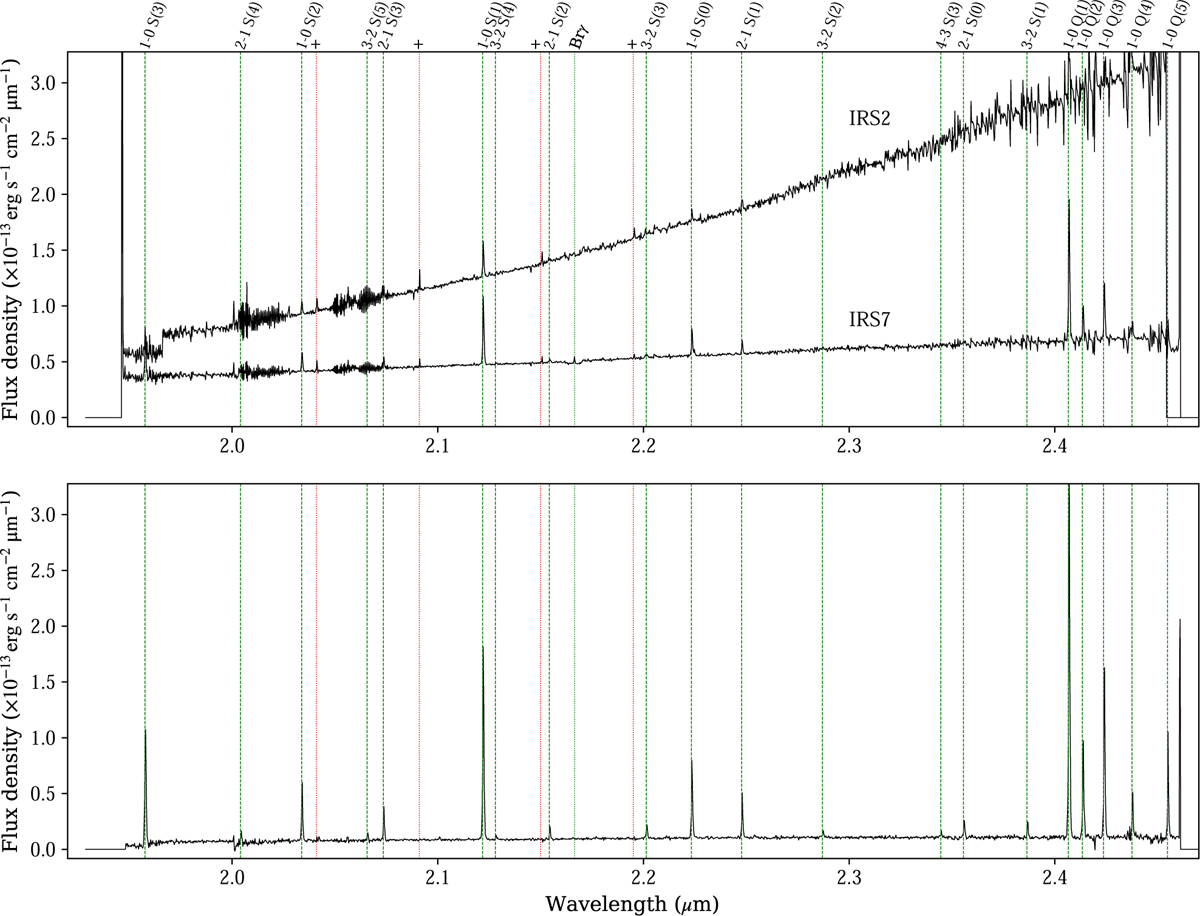
Top: spectra for IRS 2 and IRS 7 as labelled. Bottom: spectrum extracted at the highest S/N in the main region of H2 emission. Extraction boxes are shown in Fig. 1. Main H2 emission lines are marked as vertical dashed green lines, Brγ as a dotted green line, and noisy peaks as dotted red lines and labelled as ‘+’.
Current usage metrics show cumulative count of Article Views (full-text article views including HTML views, PDF and ePub downloads, according to the available data) and Abstracts Views on Vision4Press platform.
Data correspond to usage on the plateform after 2015. The current usage metrics is available 48-96 hours after online publication and is updated daily on week days.
Initial download of the metrics may take a while.