Fig. 3
Download original image
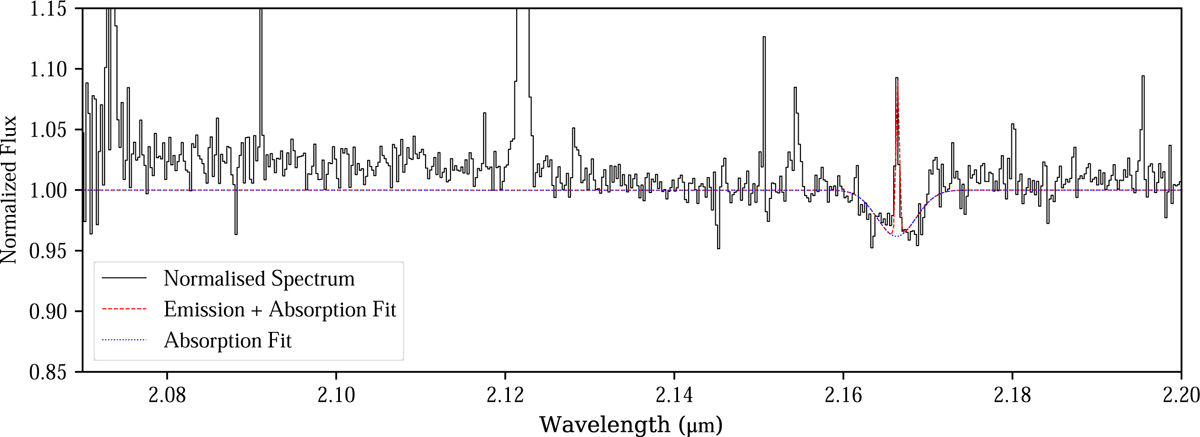
Zoom-in of the IRS 7 spectrum at the 2.07–2.20 µm range. A double Gaussian profile (emission plus absorption) fit to the Brγ line is shown as a dashed red line, whereas the dotted blue line shows the single Gaussian profile fit to the absorption component. Strong emission lines correspond to H2, in particular 2–1 S(3), 1–0 S(1), 3–2 S(4), and 2–1 S(2), at 2.074, 2.122, 2.128, and 2.154 µm, respectively.
Current usage metrics show cumulative count of Article Views (full-text article views including HTML views, PDF and ePub downloads, according to the available data) and Abstracts Views on Vision4Press platform.
Data correspond to usage on the plateform after 2015. The current usage metrics is available 48-96 hours after online publication and is updated daily on week days.
Initial download of the metrics may take a while.