Press Release
Open Access
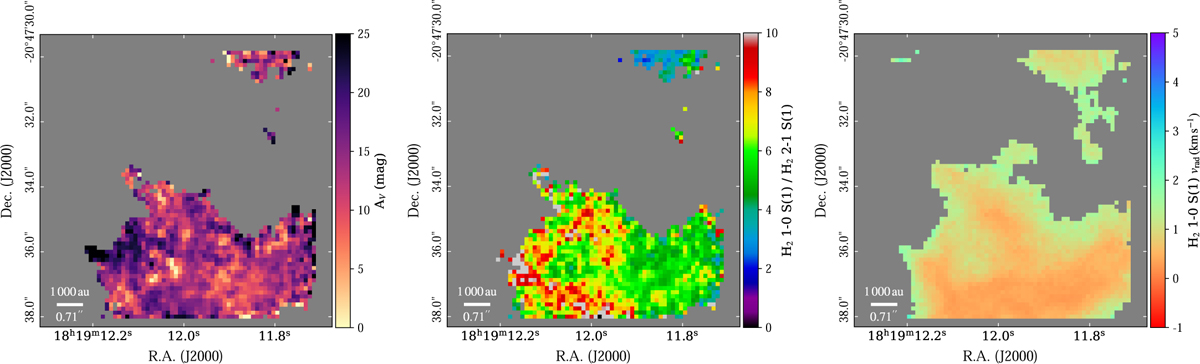
Fig. 4
Download original image
Left: extinction map obtained from the H2 1–0 Q(3)/1–0 S(1) line ratio. Middle: excitation map from the H2 line ratio 1–0 S(1)/2–1 S(1). Right: radial velocity map using the H2 1–0 S(1) line. In all panels, grey indicates masked pixels with S/N < 3.
Current usage metrics show cumulative count of Article Views (full-text article views including HTML views, PDF and ePub downloads, according to the available data) and Abstracts Views on Vision4Press platform.
Data correspond to usage on the plateform after 2015. The current usage metrics is available 48-96 hours after online publication and is updated daily on week days.
Initial download of the metrics may take a while.