Fig. 5
Download original image
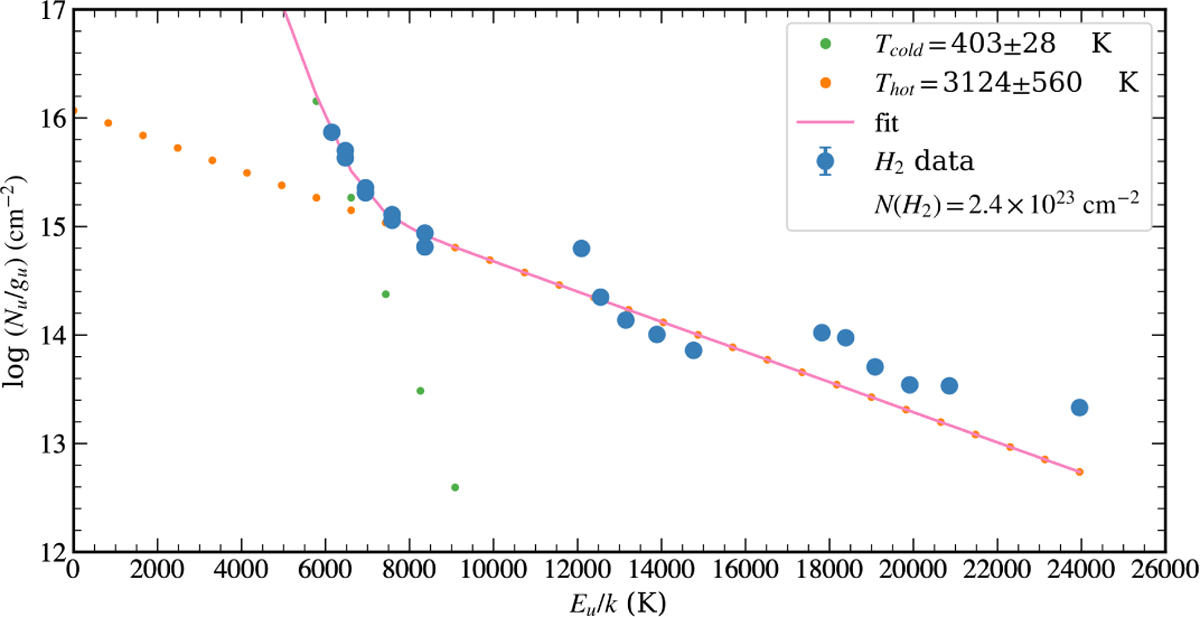
Ro-vibrational diagram using the fluxes extracted from the white south box depicted in Fig. 1 and summarised in Table 1. The blue circles represent the observed H2 data after extinction correction (AV = 12 mag), and the pink line shows the two-temperature component. The plot was generated using the PDR Toolbox (Pound & Wolfire 2023).
Current usage metrics show cumulative count of Article Views (full-text article views including HTML views, PDF and ePub downloads, according to the available data) and Abstracts Views on Vision4Press platform.
Data correspond to usage on the plateform after 2015. The current usage metrics is available 48-96 hours after online publication and is updated daily on week days.
Initial download of the metrics may take a while.