Fig. 6
Download original image
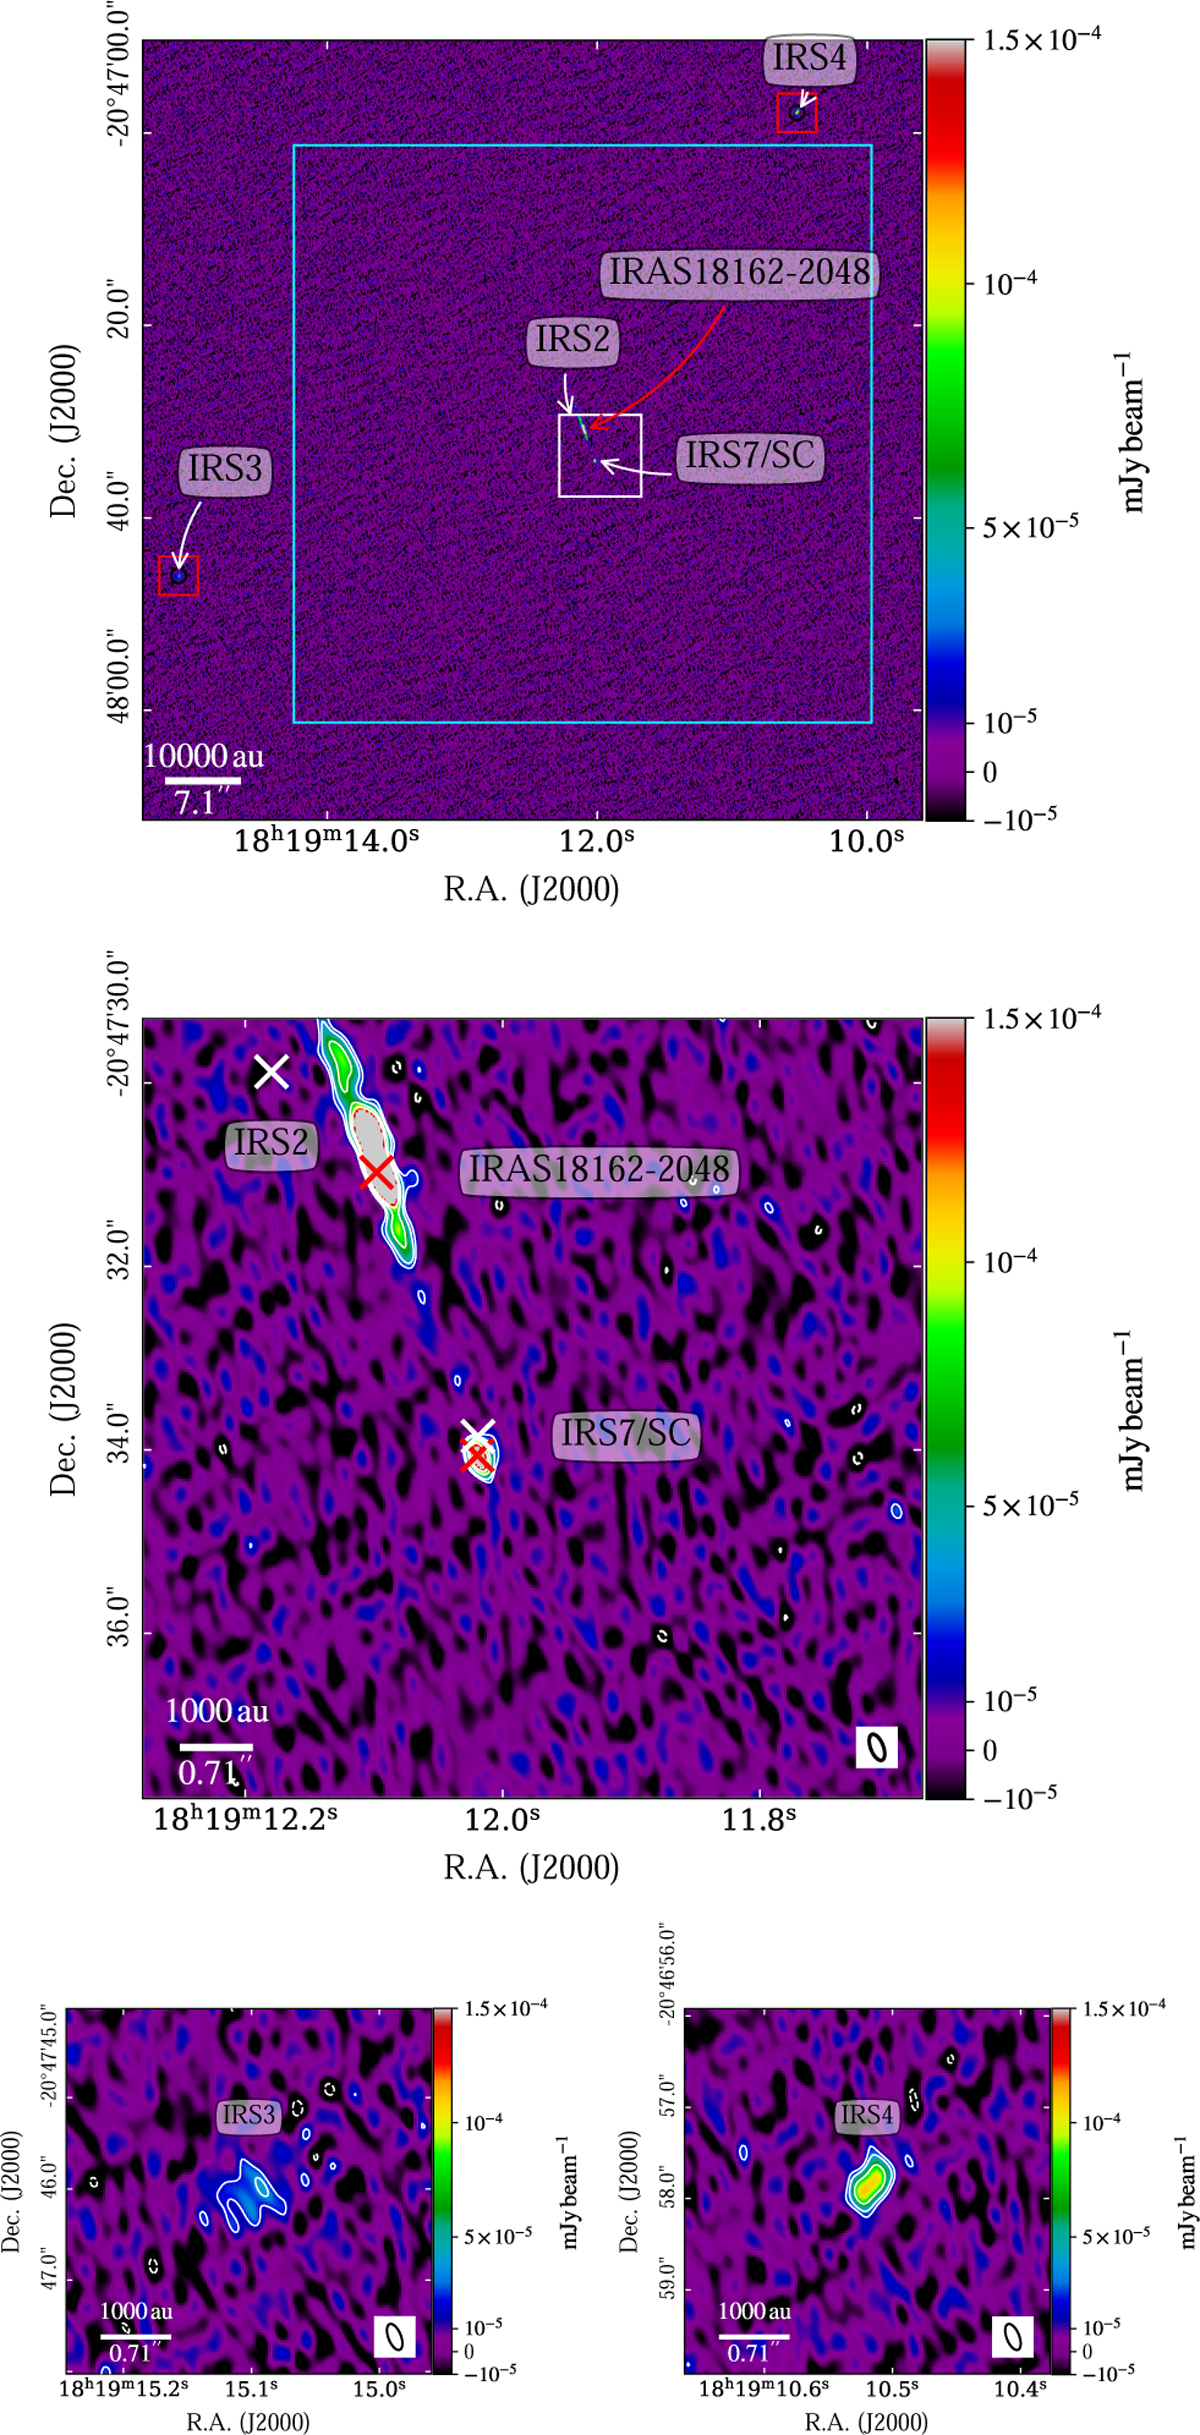
Top: VLA X and C band continuum image. The cyan box represents the field shown in Fig. 7, whereas the white box represents the FoV of SINFONI. The main sources in the region are labelled. Middle: same as above but zoomed in on the SINFONI FoV. Contours are (−3, 3, 5, 10, 15) × σX+C where σX+C = 7µJy beam−1. The red crosses represent the VLA positions for IRAS 18162-2048 and IRS 7/SC, and the white crosses are the SINFONI positions for IRS 2 and IRS 7/S. Bottom: zoomed in views of the red boxes in the top panel highlighting IRS 3 (left) and IRS 4 (right). The synthesised beams are shown at the bottom-right corners.
Current usage metrics show cumulative count of Article Views (full-text article views including HTML views, PDF and ePub downloads, according to the available data) and Abstracts Views on Vision4Press platform.
Data correspond to usage on the plateform after 2015. The current usage metrics is available 48-96 hours after online publication and is updated daily on week days.
Initial download of the metrics may take a while.