Fig. 8
Download original image
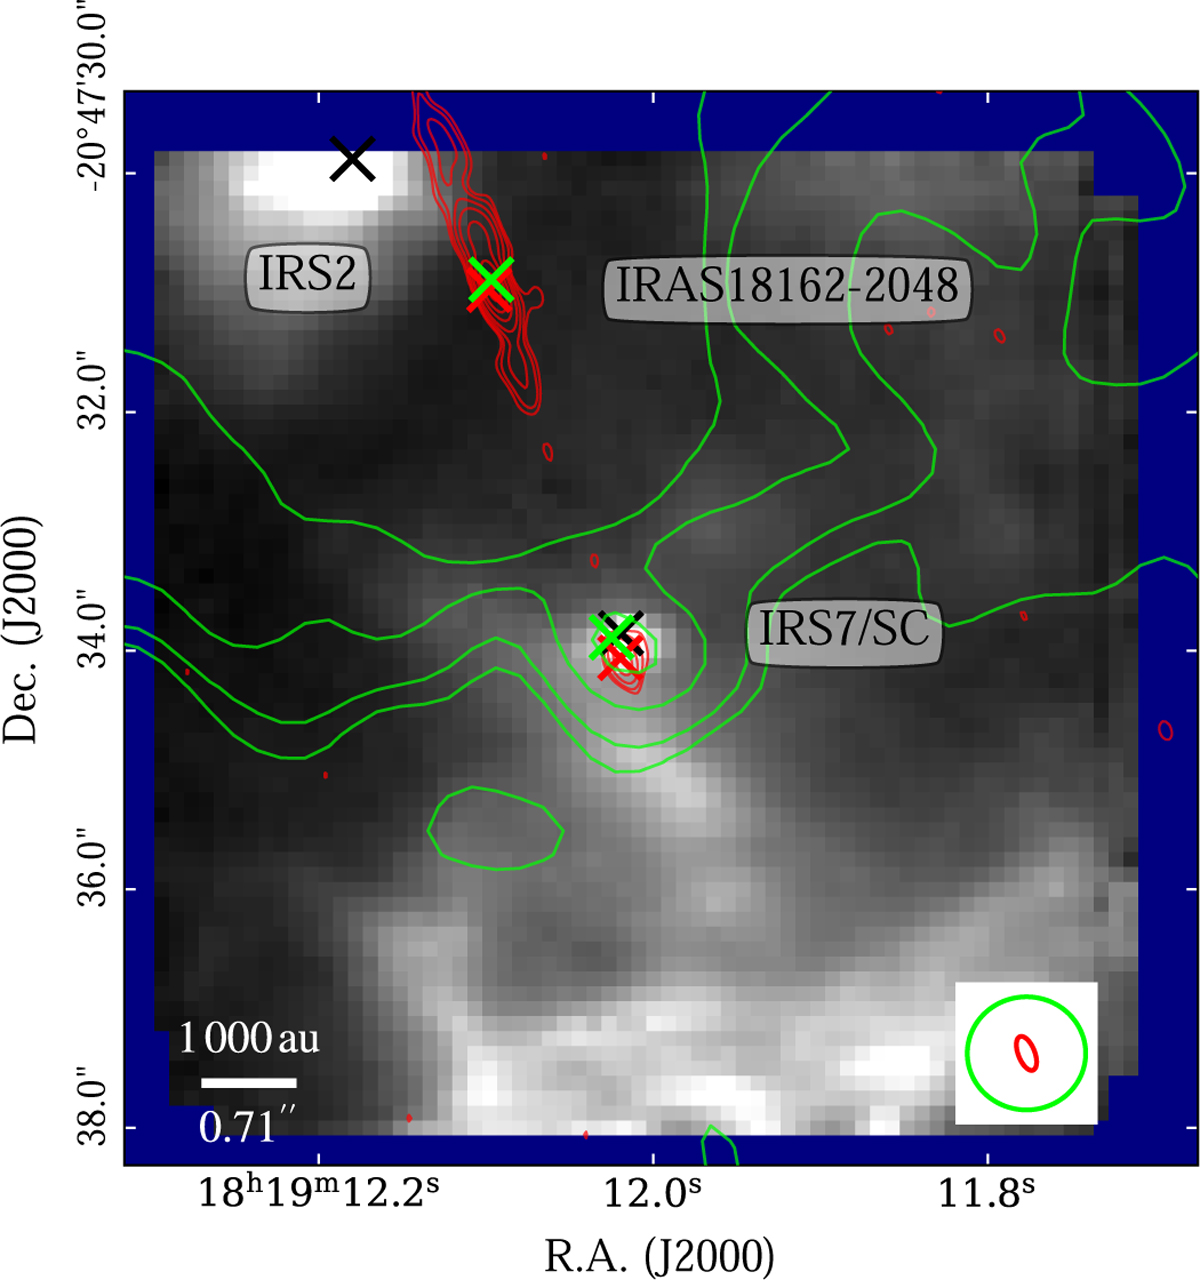
Inner 10 000 au view of the IRAS 18162-2048 high-mass star-forming region. The greyscale image is H2 1-0 S(1) at 2.12 µm. Red contours are VLA X and C bands in the A configuration. Contours are (3, 5, 10, 20, 50, 100, 200) × σX+C, where σX+C = 7µJy beam−1. Green contours are ALMA ∼3.3 mm. Contours are (3, 5, 10, 15) × σ3.3mm, where σ3.3mm = 18µJy beam−1. Black crosses correspond to SINFONI positions. The synthesised beams are shown at the bottom-right corner.
Current usage metrics show cumulative count of Article Views (full-text article views including HTML views, PDF and ePub downloads, according to the available data) and Abstracts Views on Vision4Press platform.
Data correspond to usage on the plateform after 2015. The current usage metrics is available 48-96 hours after online publication and is updated daily on week days.
Initial download of the metrics may take a while.