Fig. 9
Download original image
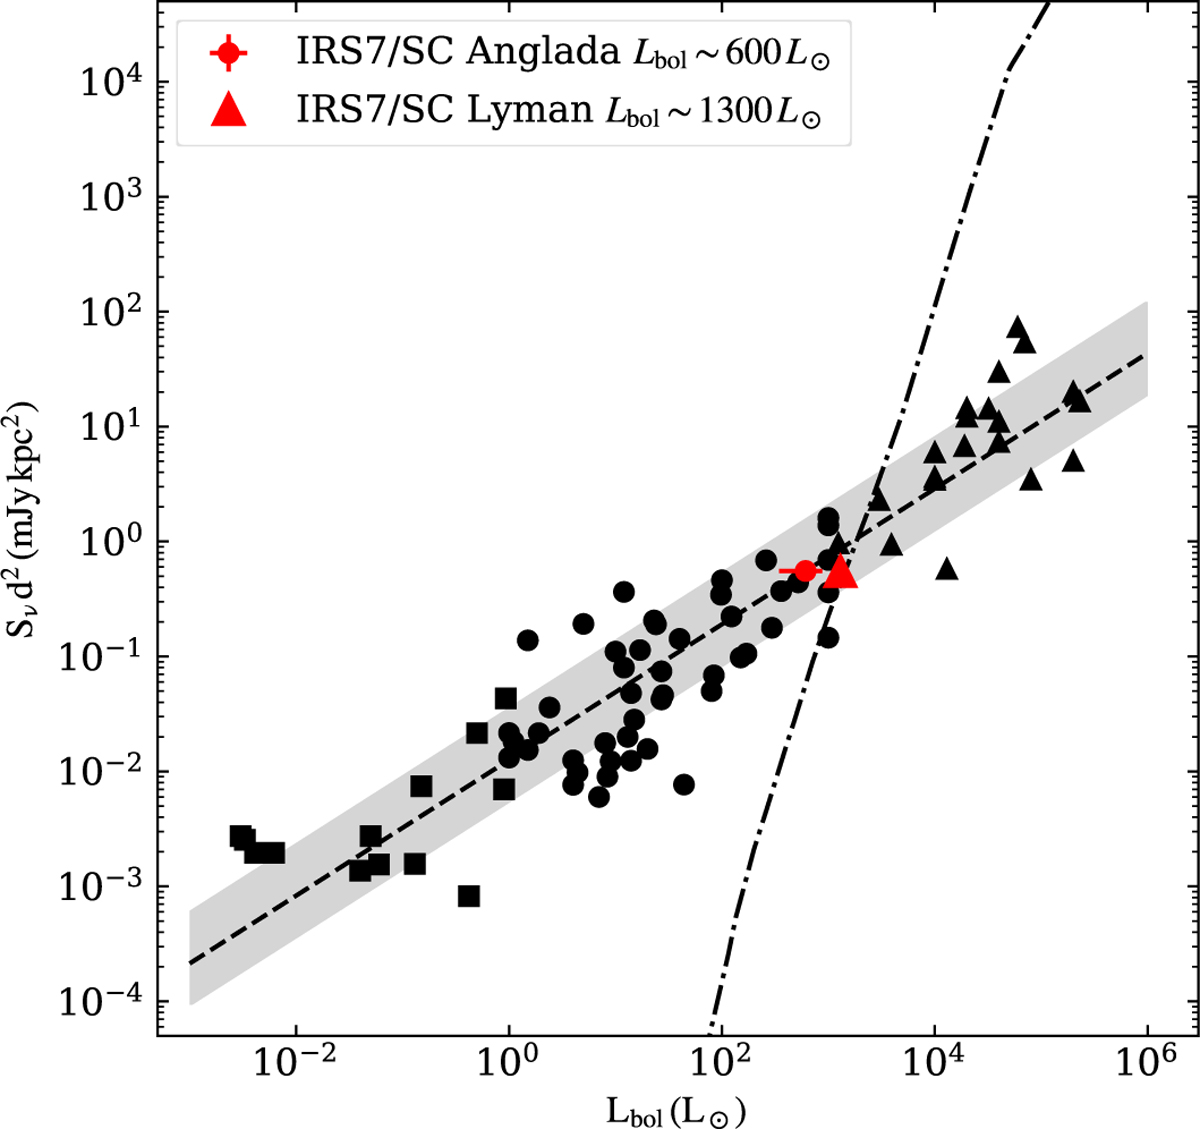
Correlation between bolometric luminosity and radio continuum luminosity at centimetre wavelengths (dashed line and shaded area). Squares represent very low luminosity (Lbol < 1 L⊙), circles low luminosity (1 ≤ Lbol ≤ 1000 L⊙), and triangles high luminosity sources (Lbol > 1000 L⊙). The dot-dashed line represents the expected radio luminosity of an optically thin region photo-ionised by Lyman continuum. The red circle corresponds to a Lbol ∼ 600 L⊙ assuming all radio flux comes from shocked-excited jet emission, whereas the red triangle corresponds to a Lbol ∼ 1300 L⊙ assuming all radio flux comes from an optically thin H II region. Both have been calculated using Sνd2 = 0.55 mJy kpc2, with ν = 8.19 GHz. The figure is adapted from Anglada et al. (2018).
Current usage metrics show cumulative count of Article Views (full-text article views including HTML views, PDF and ePub downloads, according to the available data) and Abstracts Views on Vision4Press platform.
Data correspond to usage on the plateform after 2015. The current usage metrics is available 48-96 hours after online publication and is updated daily on week days.
Initial download of the metrics may take a while.