Fig. 1
Download original image
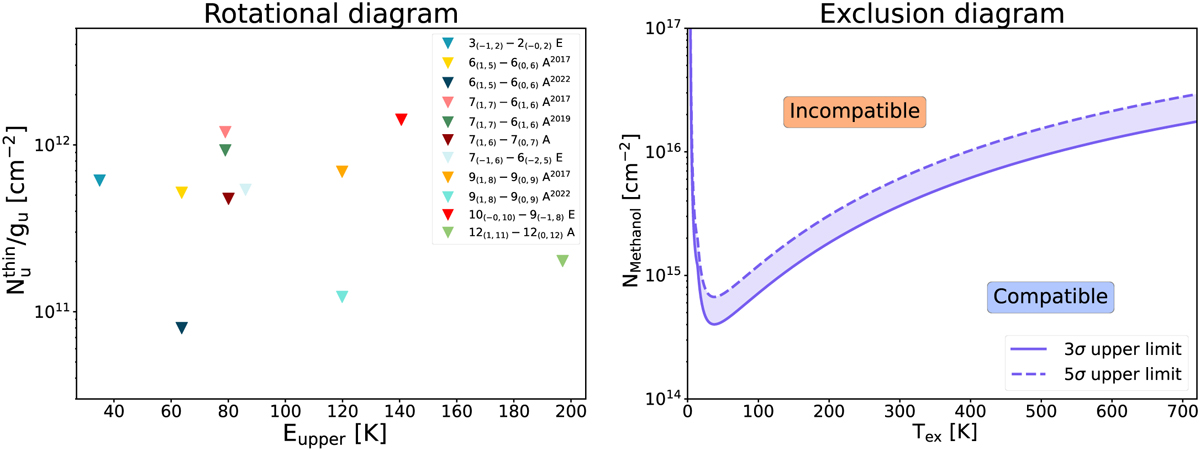
Left: rotational diagram built from the methanol nondetections. In the legend, each transition is labelled by its quantum numbers. For lines covered in multiple programs, the year of the program is also shown. Right: exclusion diagram showing excitation temperatures and total column densities compatible with the 3σ and 5σ upper limits on the total CH3OH column density (the 3σ limits are shown in the left panel).
Current usage metrics show cumulative count of Article Views (full-text article views including HTML views, PDF and ePub downloads, according to the available data) and Abstracts Views on Vision4Press platform.
Data correspond to usage on the plateform after 2015. The current usage metrics is available 48-96 hours after online publication and is updated daily on week days.
Initial download of the metrics may take a while.