Fig. 2
Download original image
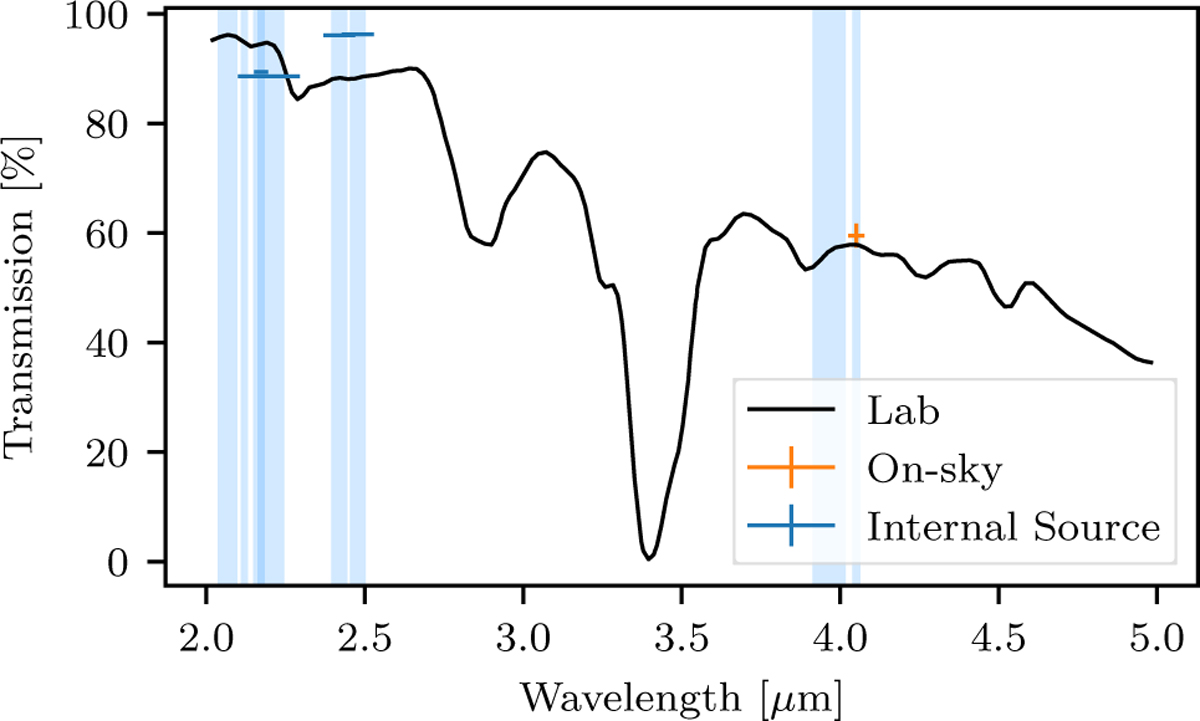
Optical transmission of the gvAPP measured in the laboratory (black curve) and the on-sky background transmission in the Br-α filter (orange point). Additional measurements with the ERIS internal calibration unit are shown by the blue points. The blue regions trace all filters available for observations with the gvAPP in ERIS. Note that for on-sky throughput, this transmission curve should be multiplied by 0.23 to account for the EE and division of the flux between coronagraphic PSFs (see Sect. 3.2).
Current usage metrics show cumulative count of Article Views (full-text article views including HTML views, PDF and ePub downloads, according to the available data) and Abstracts Views on Vision4Press platform.
Data correspond to usage on the plateform after 2015. The current usage metrics is available 48-96 hours after online publication and is updated daily on week days.
Initial download of the metrics may take a while.