Fig. 4
Download original image
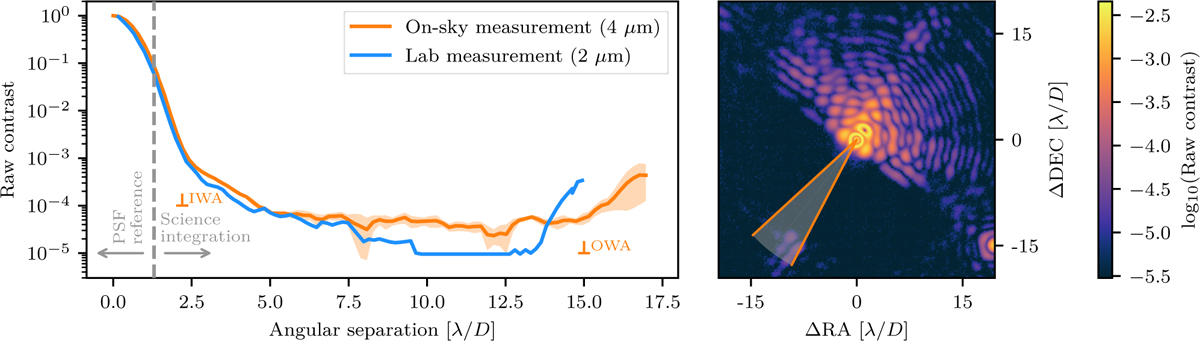
Raw contrast of the gvAPP in the Br-α-continuum filter. Left: raw flux contrast evaluated in λ/D-sized apertures placed in the dark hole over an aperture placed on the PSF centre in the left lobe of a deep integration on HR 8799 at 3.96 µm. The orange line traces the median contrast evaluated in a ±10◦ region perpendicular to the main axis of the gvAPP PSF. The orange markers indicate the IWA and OWA provided in Table 1. The blue curve displays the raw contrast measured on the gvAPP element under laboratory conditions at 2 µm by Boehle et al. (2021) – the values from 10 to 12.5 λ/D are below the sensitivity of the test bench. The rise seen at 13.5 λ/D in the laboratory data is due to limitations from internal reflections in the test bench not present in ERIS. Right: focal plane image of the left lobe of the gvAPP on which the raw contrast was evaluated. The shaded orange wedge is the ±10◦ region in which the orange contrast curve was measured.
Current usage metrics show cumulative count of Article Views (full-text article views including HTML views, PDF and ePub downloads, according to the available data) and Abstracts Views on Vision4Press platform.
Data correspond to usage on the plateform after 2015. The current usage metrics is available 48-96 hours after online publication and is updated daily on week days.
Initial download of the metrics may take a while.