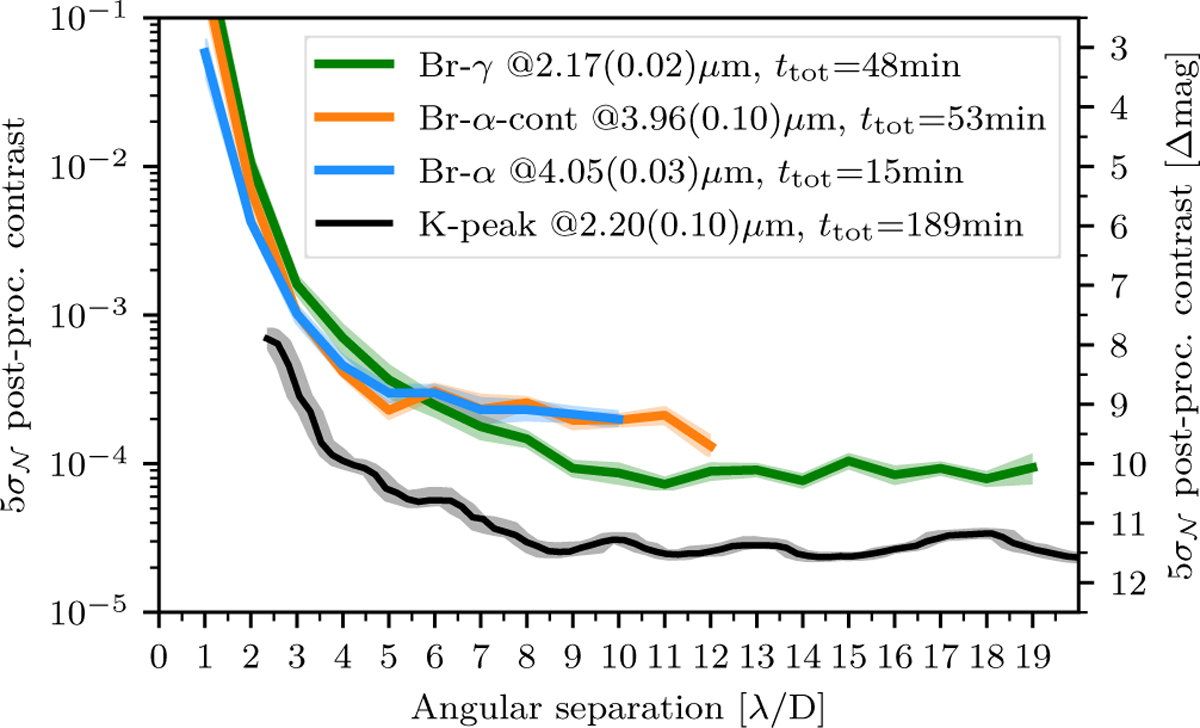
Fig. 5
Download original image
Post-processed contrast of the ERIS gvAPP in the Br-γ, Br-α, Br-α-continuum, and K-peak filters. The contrast curves for the first three filters were calculated after PSF subtraction with optimal PCA/ADI via fake planet injections. The contrast curve for the K-peak filter was calculated with the TRAP algorithm (Samland et al. 2021). The angular separation is shown in units of λ/D in order to compare the results for the different narrow band filters. The central wavelength and effective width of each filter are indicated in the label of each curve. The shaded area represents the uncertainty of the contrast curve.
Current usage metrics show cumulative count of Article Views (full-text article views including HTML views, PDF and ePub downloads, according to the available data) and Abstracts Views on Vision4Press platform.
Data correspond to usage on the plateform after 2015. The current usage metrics is available 48-96 hours after online publication and is updated daily on week days.
Initial download of the metrics may take a while.